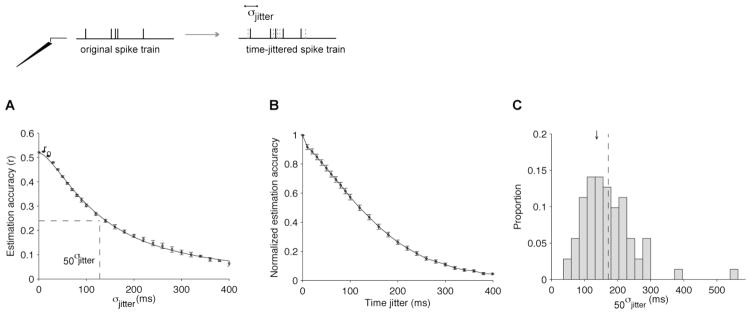
Figure 6. Robustness to spike time jitter.
(A) Example electrode showing the mean estimation accuracy as a function of the spike time jittering for an example electrode in V1 (spontaneous activity). For each value of σjitter, we randomly shifted each spike train by an amount taken from a gaussian distribution with mean=0 and standard deviation σjitter (see scheme at the top). We show the mean estimation accuracy averaged across all test trials. Error bars indicate one SEM. “r0” denotes the estimation accuracy obtained for σjitter=0. The continuous line indicates a fit with the following function: where 50σjitter and n are free parameters.
(B) For each electrode, we repeated the procedure described in (A) and normalized r by dividing it by r0 (“Normalized estimation accuracy”). We show the mean normalized estimation accuracy across all electrodes (n=88) using the “electrode-specific” filters.
(C) Distribution of 50σjitter for all V1 electrodes recorded during spontaneous activity (n=88). The black arrow shows the position of the example from part (A). The dashed vertical line indicates the mean value: the mean value of 50σjitter was 172 ± 89 ms (mean±SD). Bin size = 25 ms.

