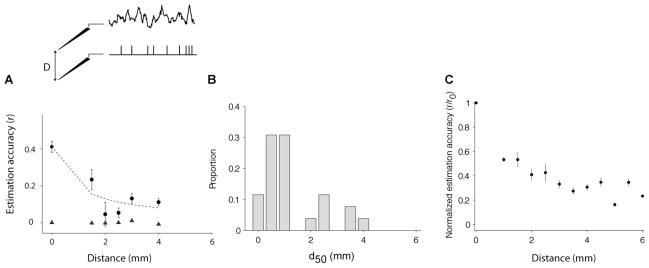
Figure 7. Dependence on LFP-spike distance.
(A) Example electrode showing the estimation accuracy as a function of the distance D between the spike train and the LFP (see scheme at the top). Here the spike train and the LFP were simultaneously recorded using different electrodes, separated by the distance given in the x-axis (Distance = 0 corresponds to the estimations reported so far where the spike train and the LFP were recorded from the same electrode). For each spike-LFP pair, we repeated the procedure described in Figure 1B to compute the W-K filter and estimate its performance. Error bars denote one SEM. The triangles show the estimation accuracy obtained under the null hypothesis (generating a Poisson spike train with the same number of spikes). The dashed line corresponds to a fit using the following function: . (B) Distribution of D50 values for the 65 electrodes where we obtained a reliable fit (p<0.01 in a Chi2 goodness-of-fit test). Bin size = 0.5 mm. (C) We followed the procedure in (A) and normalized r by r0 for all the V1 electrodes recorded during spontaneous activity (n=88). The estimation accuracies were binned according to the spike-LFP distance using a bin size of 0.5 mm. Error bars correspond to one SEM. The mean estimation accuracy decreases by about 50% when the distance between the LFP and spike train location is 1 mm. We did not have any electrode pair with Distance < 1 mm in these data.

