
Figure 8. Causal filters.
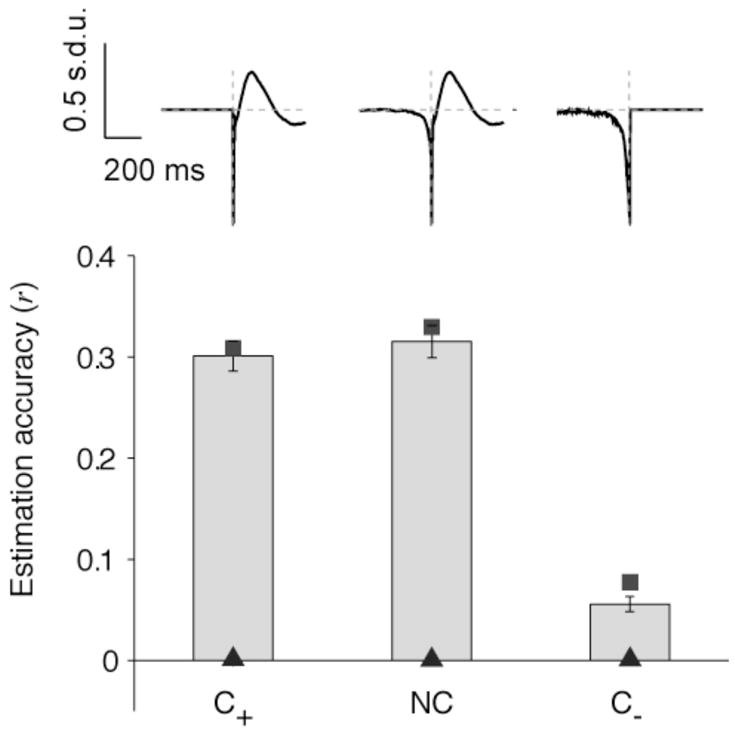
Mean estimation accuracies (“electrode-specific” filters, V1, spontaneous activity) for three different filters: NC (non causal filter, as used in Figures 2–7), C+ (only has information for positive time lags; hC+(α) = 0 for α < 0)) and C− (only has information about negative time lags; hC−(α) = 0 for α > 0)). The conventions are the same as in Figure 3. Error bars denote one SEM (n=88 electrodes). The squares indicate the mean reconstruction accuracy. The triangles indicate the mean estimation accuracies under the null hypothesis (generating a Poisson spike train with the same number of spikes). All the LFP estimation accuracies shown here are statistically significant compared with the estimations obtained under the null hypothesis (p<0.01, two-sample Kolmogorov-Smirnov test). The estimations obtained with NC and C+ are statistically indistinguishable (p>0.1) and there is a significant difference between the estimations obtained with either NC or C+, and C− (p<0.01).