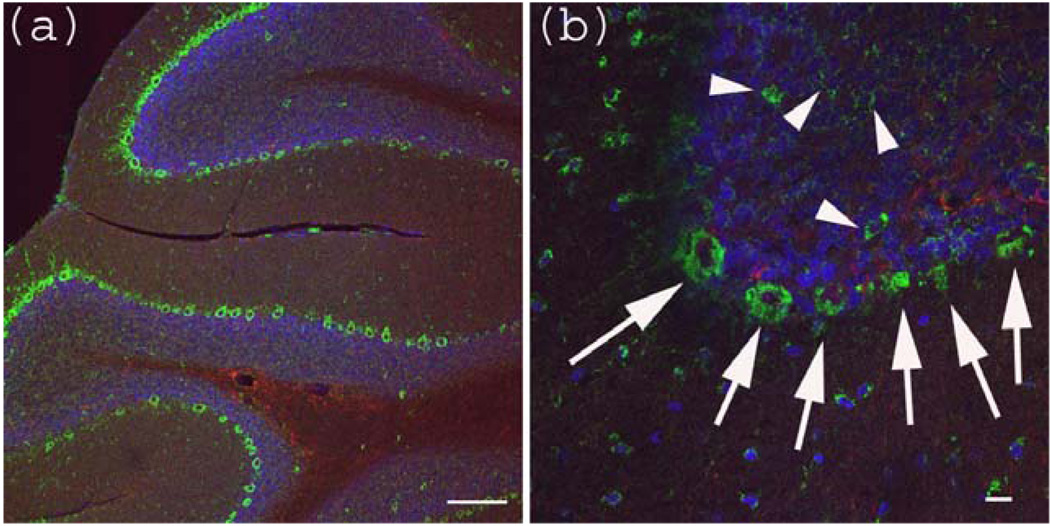
Figure 3.
Anti-Gb3-Ab staining of cerebellum. (a) Cerebellum sections were stained with anti-Gb3 Ab (Green), anti-GFAP-Ab (Red) and DAPI (Blue). Perkinje layer is shown reactive to anti-Gb3-Ab. Bar indicates 100 µm. (b) Higher magnification of (a). Arrows indicate anti-Gb3-Ab positive Perkinje cells, while arrowheads indicate anti-Gb3-Ab positive neurons in the granule layer. Bar indicates 10 µm.

