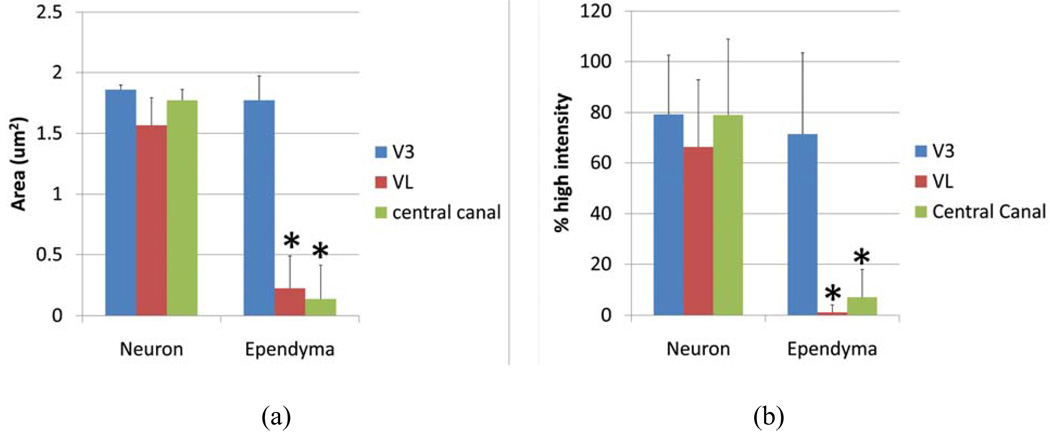
Figure 5.
Intesnsity of anti-Gb3-Ab staining in neurons vs. ependyma. (a) High intensity area comparison of neurons and ependymal cells from V3, VL or central canal. Values from each region (neuron vs. ependyma) are compared, and the statistically significant difference is shown as (*). (b) High intensity percentage from Line profile analysis comparing neurons and ependymal cells from V3, VL or central canal. Values from each region (neuron vs. ependyma) are compared, and statistically significant differences are shown as (*). * indicates p < 0.01 in 2-tailed, paired t-test.

