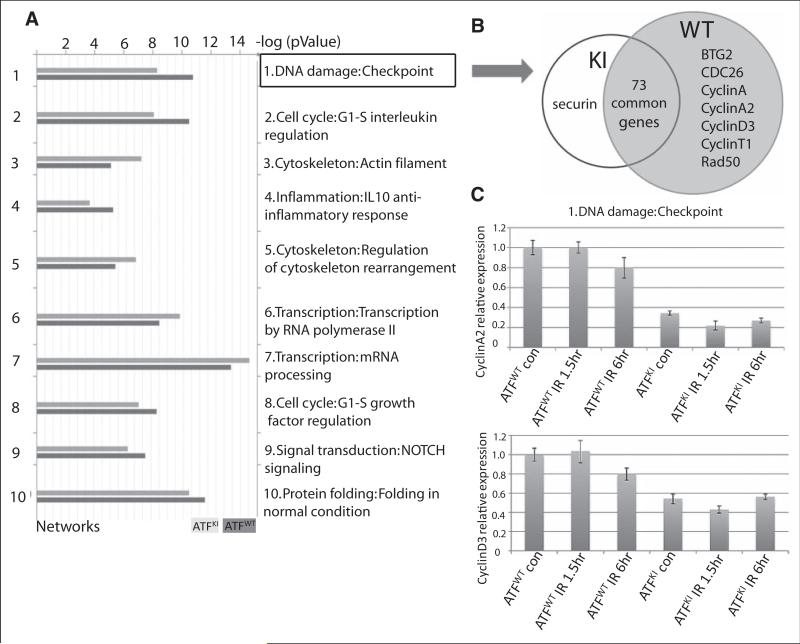
Figure 5.
GeneGo analysis identified DNA damage checkpoint networks that topped the list of changes between wild-type (ATF2WT) and ATF2KI groups. (A) ATF2WT and ATF2KI murine embryonic fibroblasts (MEFs) were subjected to 10Gy ionizing radiation (IR), and RNA samples were prepared 1 hour later to determine gene expression levels using the illumina array platform (see Materials and Methods for details). The array data were analyzed using the GeneGo enrichment software package. Shown are the top 10 clusters of gene networks that exhibit significant changes in gene expression between the ATF2KI and ATF2WT samples. (B) Genes that belong to DNA damage checkpoint are grouped in knock-in (ATF2KI) and ATF2WT. Uniquely expressed genes are listed in the circle. (C) qPCR analysis of cyclin A2 and cyclin D3 transcript levels performed on MEF from ATF2WT and ATF2KI mice following the indicated.

