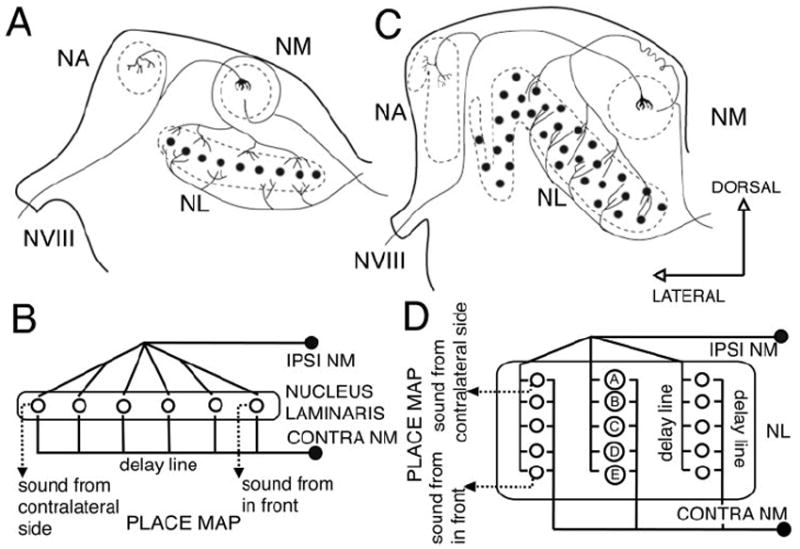
Figure 1.

Schematic showing the Jeffress model for sound localization as applied to chicken and owl. The Jeffress model proposed that time differences can be measured with the use of two elements: delay lines and coincidence detectors. A coincidence detector will fire maximally when the input from both sides arrives at the same time, that is, when the delay of the onset of the stimuli is equal and opposite to the retardation imposed by the delay line. A, Schematic cross section through a chicken brainstem showing the organization of the projections from NM to NL. This organization conforms to a modified Jeffress model (B) with delay lines formed by the contralateral NM axons that run ventral to NL. This results in a map of ITD oriented in the mediolateral dimension, with cells in more lateral positions responding maximally to sounds originating from far contralateral space, and cells in a more medial position responding maximally to sounds originating from the front. C, Schematic cross section through an owl brainstem showing the organization of the projections from NM to NL. The organization of the delay lines conforms to the Jeffress model (D). NM axons enter NL and traverse it, making contact with NL neurons (A–E) along their way. This results in multiple maps of ITD (D) with space mapped in a dorsoventral dimension. Neurons located in the dorsal edge of NL respond maximally to sounds originating from far contralateral space (neuron A), and neurons located in more ventral positions respond maximally to sounds originating from the front (neuron E). (Modified from Kubke and Carr, 2000). VIII, Cochleovestibular nerve; NA, nucleus angularis; NM, nucleus magnocellularis; NL, nucleus laminaris.
