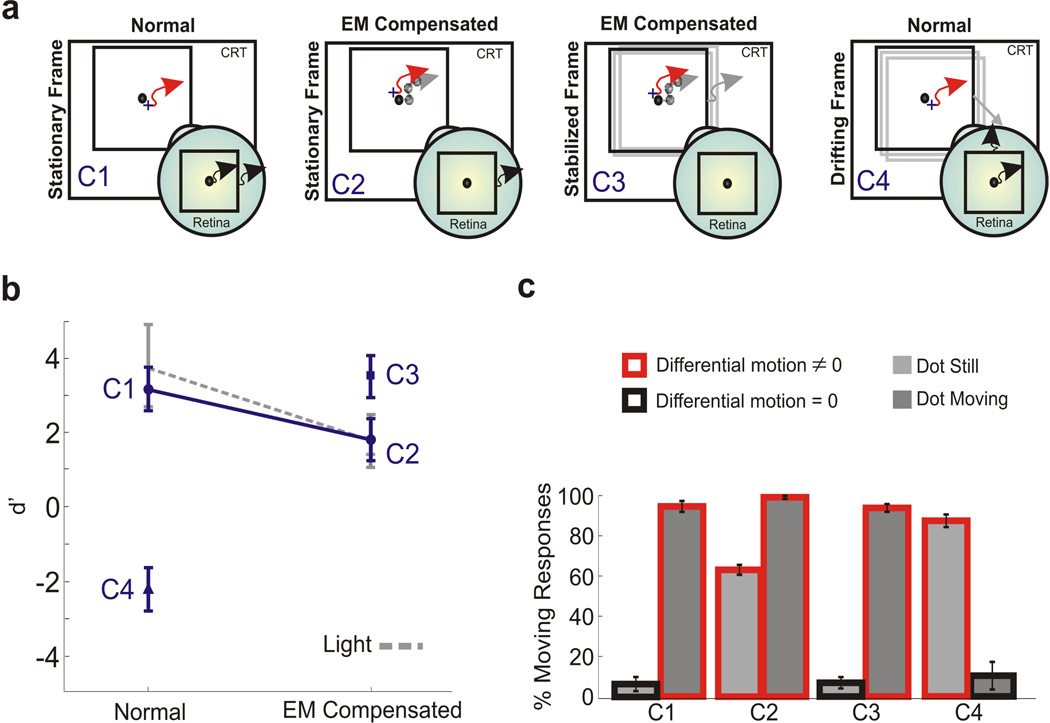
Figure 3.
Effect of adding a visual reference. The experiment was identical to that of Fig. 1, except for the presence of a 9° square. Stimuli were observed in darkness. (a) Motion of the stimulus on the monitor and on the retina in the various conditions. Red and grey arrows represent the trajectories of eye movements and the stimulus, respectively. Black arrows indicate retinal image motion. For clarity, only the dot-still case is shown. (b−c) Mean d’ scores and percentages of motion responses measured with the square stationary on the screen (conditions C1 and C2), stationary on the retina (C3), and translating on the screen (C4). In C4, the square either drifted with the dot or, in the dot-still trials, translated in a random direction at 30’/s. The dashed line represents d’ values for the same subjects measured with the single dot (no square) in an illuminated environment. Error bars represent 95% confidence intervals (N = 3).

