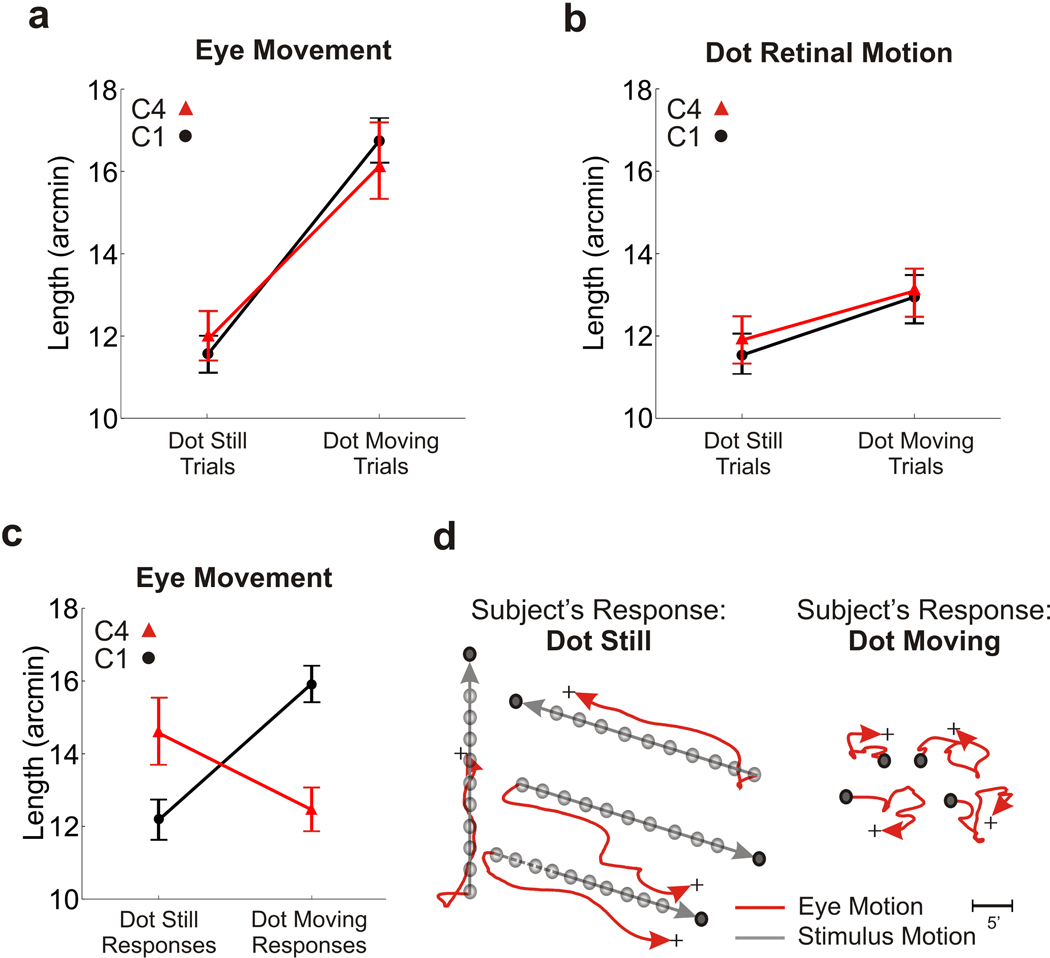
Figure 4.
Eye movements and retinal image motion in the experiment of Fig. 3. Data refer to the normal viewing conditions (C1 and C4). (a−b) Lengths of ocular drift and of the retinal trajectory followed by the dot in the two types of trials. (c) Mean drift length as a function of the subject’s response. Perceptual reports did not depend on the amount of ocular drift. (d) Examples of eye movement traces in C4, the condition of induced motion. Data points represent means ± sem.

