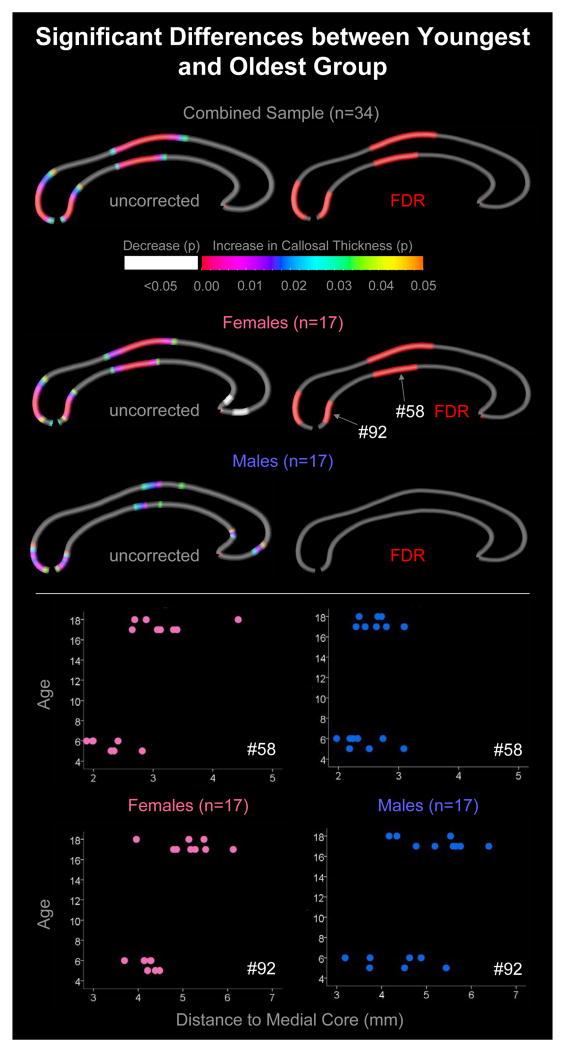
Figure 3.
Significant differences in callosal thickness between youngest group (5-6 year-olds) and oldest group (17-18 year-olds). Left Panels: The color bar encodes the uncorrected significance (p) of callosal increase. White regions indicate significant decrease. Right Panels: Callosal maps indicate in red where significant group differences survived FDR-corrections. Bottom Panels: Scatter plots illustrate examples of sex-specific callosal thickness at the two most significant callosal surface points within females (points #58 and #92).

