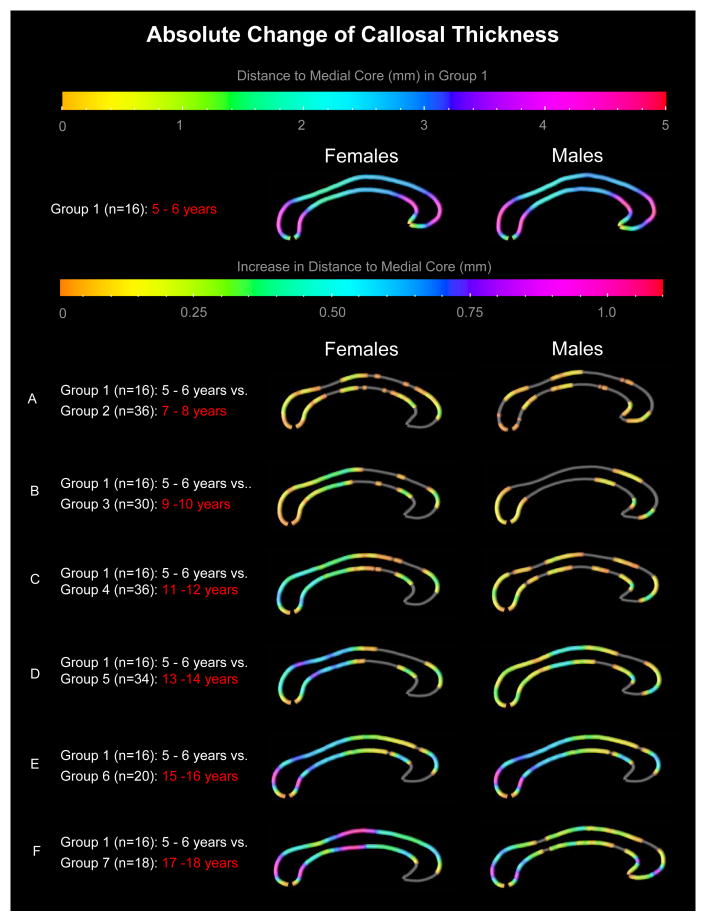
Figure 4.
Absolute Change of Callosal Thickness. Row 1 displays the average callosal thickness in Group 1 (i.e., at age 5-6 years). The color bar indicates the distance from the upper / lower callosal boundaries to the medial core with the maximum at 5 mm. The rows A-F display the absolute change in callosal thickness over time (i.e., compared to Group 1). The color bar encodes the increase in distance to the medial core with the maximum at 1.1 mm. Gray regions indicate no change or decrease.

