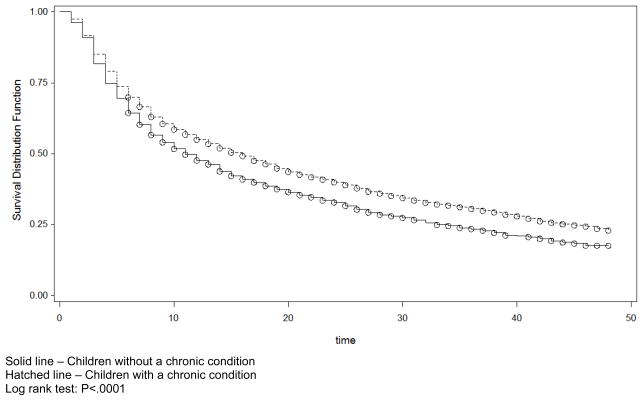
Figure 1.
Kaplan-Meier Curves for Newly Medicaid-Enrolled Children Age 3–14 with a Chronic Condition (solid line) and without a Chronic Condition (hatched line) Indicating the Proportions without a First Dental Visit (Y-axis) and the Time to First Dental Visit in Months (X-axis)
Solid line – Children without a chronic condition
Hatched line – Children with a chronic condition
Log rank test: P<.0001

