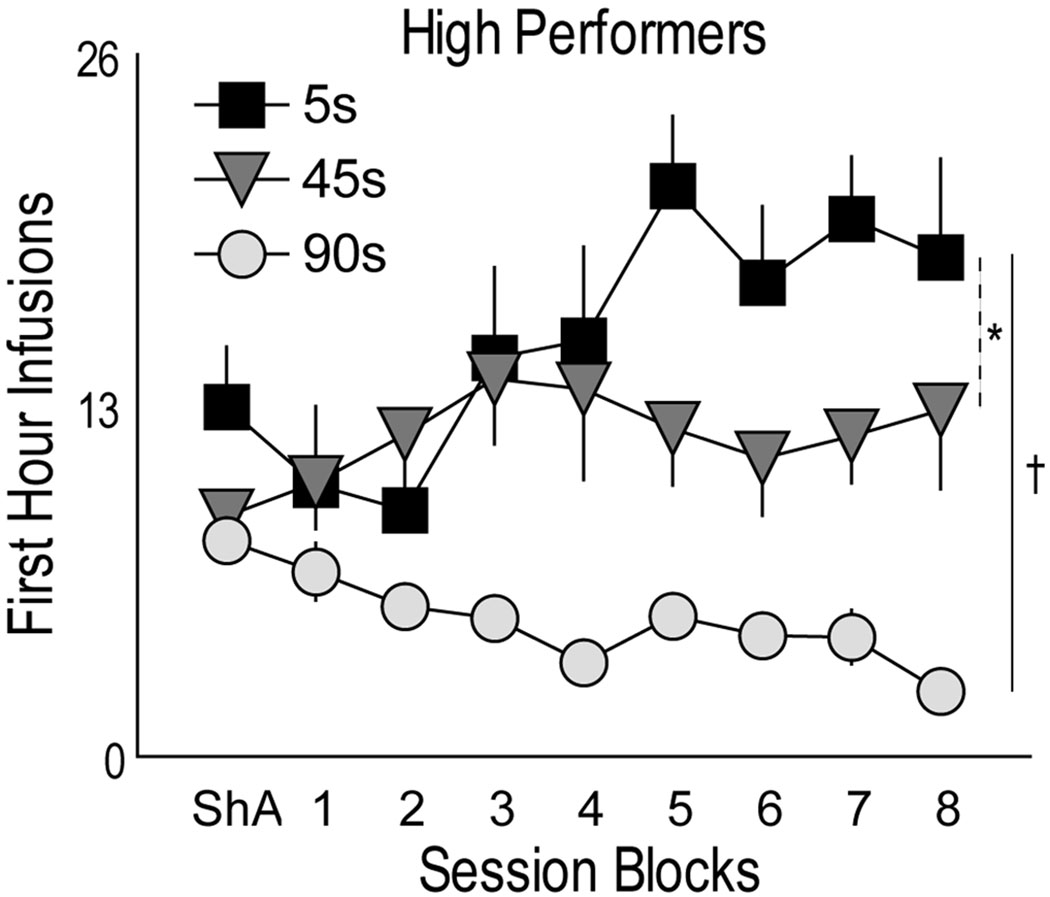
Fig. 6.
The mean (±SEM) number of infusions during the first hour of each session in “high performers” in each group, plotted over days of testing. “High performers” in each group were those that took above the median number of injections (top 50%) during the first hour (averaged across all LgA sessions). (*) indicates 5 vs. 45 sec, p<0.05, and (†) indicates 5 vs. 90 sec, p<0.001 and interaction p<0.045.

