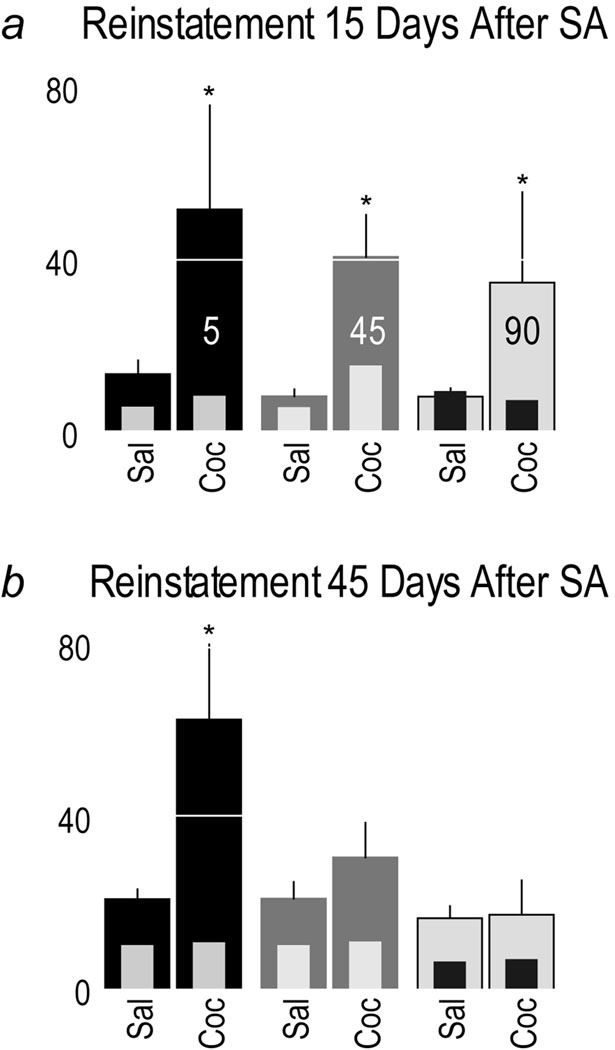
Fig. 8.
Panel a shows the mean (+SEM) number of nosepokes during the first reinstatement test, conducted 14–15 days after the last self-administration session, and 3 days after extinction training was completed. On Day 14 all rats received an injection of saline i.p. (Sal) and the next day (Day 15) an injection of cocaine i.p. (Coc). (*) indicates a main effect of cocaine treatment (p<0.004). Panel b shows data from the second reinstatement test, which was conducted 45 days after the last self-administration session and 30 days after the first reinstatement test. The number of active nosepokes are represented by thick bars, and inactive nosepokes by thin inset bars. (*) indicates saline vs. cocaine in the 5 sec group t(13)=2.383 p<0.0167.

