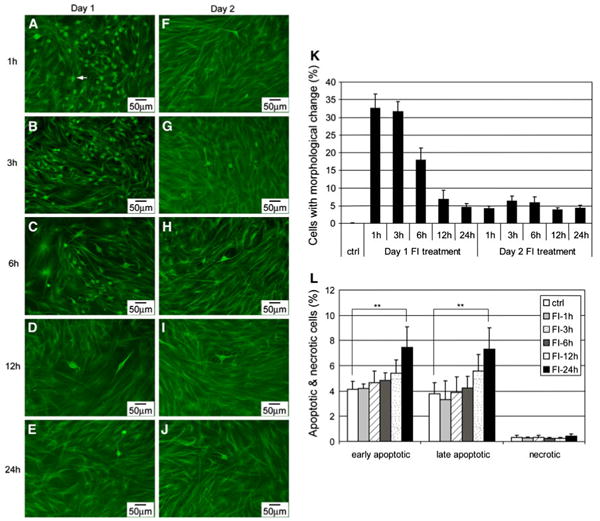
Fig. 2.

a–j Morphology of MSCs induced with 10 μM forskolin and 100 μM IBMX (FI) for different amount of time. Cells with changed morphology appear as green dots (as indicated by the arrowheads) at the magnification noted. a–e On day 1, cells treated with FI for 1, 3, 6, 12, and 24 h, respectively. f–j One day after FI treatment, cells treated again with FI for 1, 3, 6, 12, and 24 h, respectively. k Quantification of the percentage of cells with changed morphology (n = 3). l Apoptotic and necrotic labeling by PI (propidium iodide) and Alexa Fluor 488-conjugated annexin V, respectively, of cells treated with FI for 1, 3, 6, 12, and 24 h. Early apoptotic cells, PI− annexin V+ cells; late apoptotic cells, PI+ annexin V+ cells; necrotic cells, PI+ annexin V− cells (n = 3). **p<0.01
