Fig. 4.

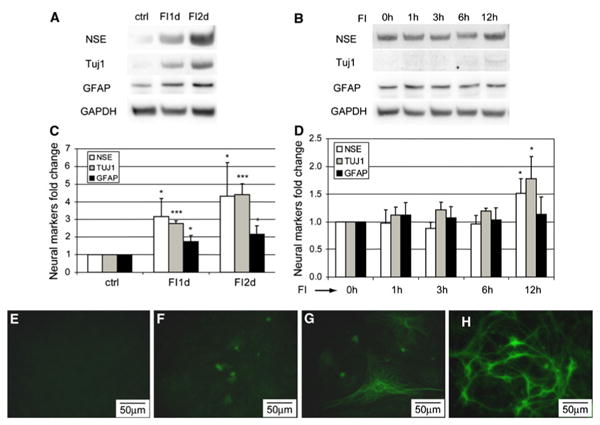
Expression of neural markers, NSE, Tuj1, and GFAP. a Protein levels of NSE, Tuj1, GFAP, and GAPDH of uninduced cells (ctrl), cells treated with 10 μM forskolin and 100 μM IBMX (FI) for 1 day (FI1d) and 2 days (FI2d). b Protein levels of NSE, Tuj1, GFAP, and GAPDH of cells treated with FI for 0, 1, 3, 6, and 12 h. c Quantification of NSE, Tuj1, and GFAP levels of the blots shown in (a) (n = 3). d Quantification of NSE, Tuj1, and GFAP levels of the blots shown in (b) (n = 3). *p<0.05; ***p<0.001. e–h Tuj1 staining of uninduced MSCs (e), MSCs treated with FI for 2 days (f) and 7 days (g) and primary neurons (h)
