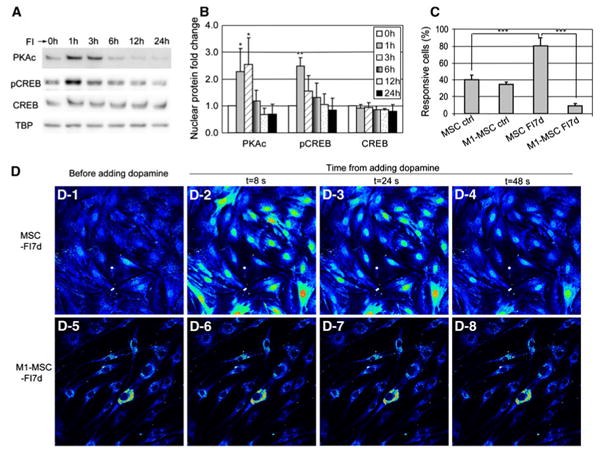
Fig. 8.

a Nuclear protein levels of PKAc, pCREB (ser133 phosphorylated CREB), and CREB in control cells and cells treated with 10 μM forskolin and 100 μM IBMX (FI) for 1, 3, 6, 12, and 24 h. b Quantification of nuclear PKAc, pCREB, and CREB levels (n = 3). *p<0.05; **p<0.01 as compared with the corresponding ‘0 h’ conditions. c Quantification of responsive cells stimulated with 100 μM dopamine. MSCs (expressing control vector) and M1-MSCs (expressing M1-CREB) were either in control media or induced with FI for 7 days (n = 3, ***p < 0.001). d A representative example of calcium signal in response to neuronal activator dopamine. D-1 to D-4 MSCs (expressing control vector) induced with FI for 1 week and stimulated with 100 μM dopamine. D-5 to D-8 M1-MSCs (expressing M1-CREB) induced with FI for 1 week and stimulated with 100 μM dopamine
