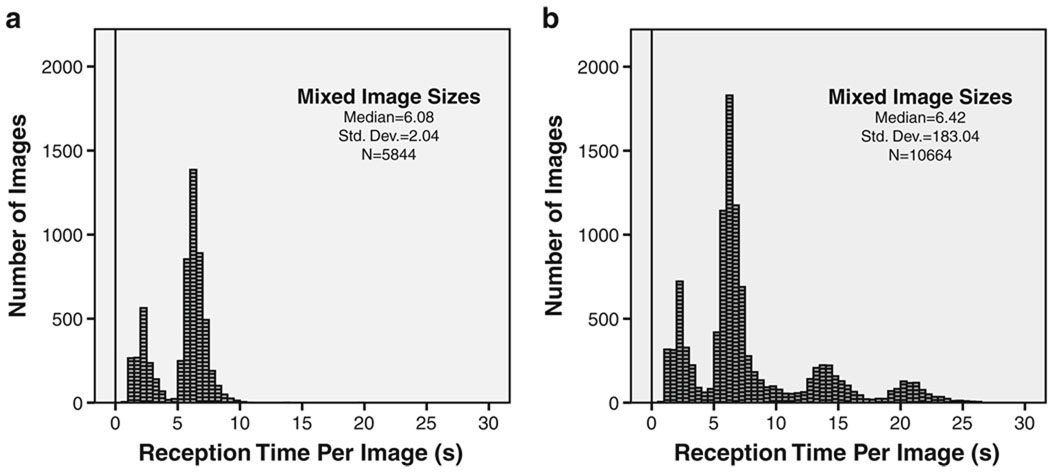
Fig. 3.
Image transmit time histograms for a mixture of two image sizes. Image transmission time was evaluated by sending large sets of MRI studies from the Malaŵi DICOM router to the MSU DICOM router, containing ~30% 256×256 matrix images and ~70% 512×512 matrix images. a The two peaks in the distribution correspond to 256×256 and 512×512 images. The histogram mode for the 256×256 image is ~2.25 s, and the mode for 512×512 images is ~6.25 s. b Histogram of the overall satellite network performance across all of the timing experiments. Some anomalous behavior occurred during two of the experiments resulting in the two additional peaks probably due to high network error rates incurring packet and or image retransmissions. One outlier measurement with a transmission time of 4.6 h caused the large standard deviation of 183.04 s (outliers are not shown in Fig. 3 plots). Ninety-nine percent of all observed transmissions had a duration less than 23.32 s.

