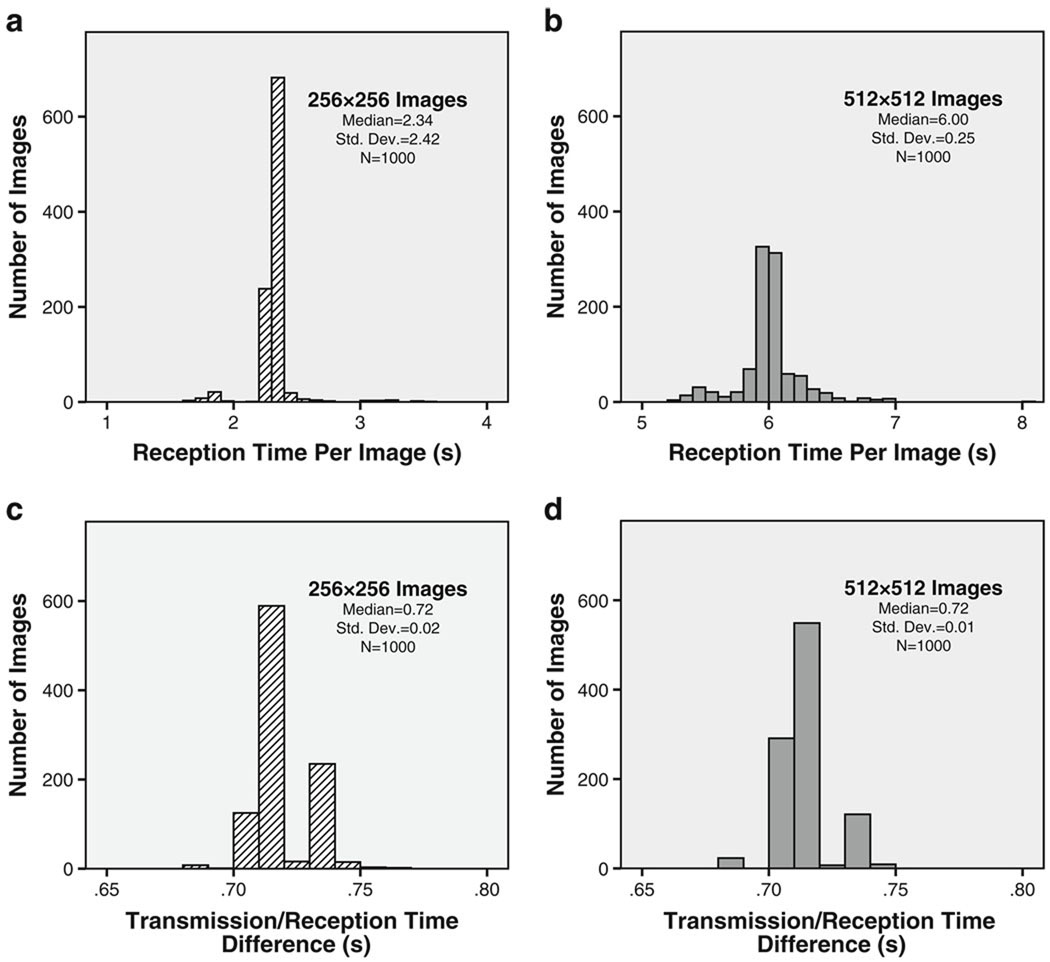
Fig. 4.
Image transit time histograms for transmitting a synthetic study comprising 1,000 duplicate MR images that were 256×256 for (a) and 512×512 for (b). c, d The respective differences in transmission time as measured by the sending and receiving DICOM routers. The c and d difference histograms are effectively showing the distribution of round-trip network latency and hence are very similar.

