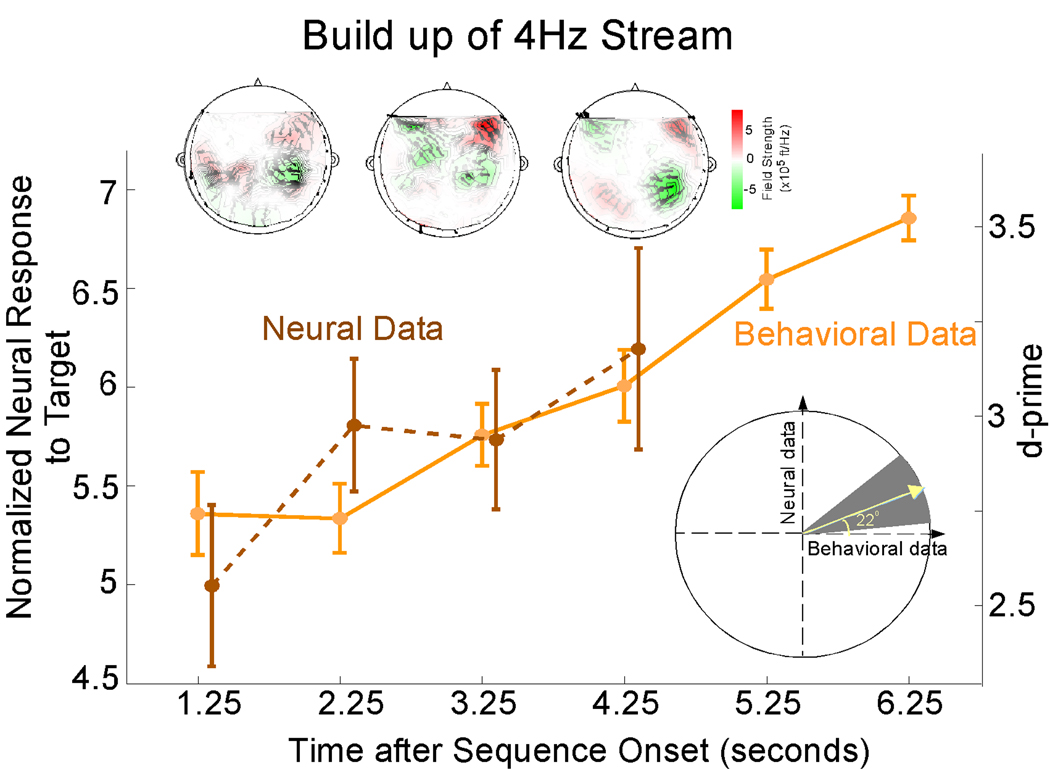
Figure 5. Buildup over time of behavioral and neural responses of target streams.
Normalized neural response to the 4 Hz stream, and behavioral performance, as a function of time during the slow task averaged across subjects. Error bars represent standard error. Top insets: The MEG magnetic field distributions of the 4 Hz target response for a single subject at representative moments in time. Bottom inset: Correlation of behavioral and neural responses as a function of time. The ratio of the neural to behavioral response trends as a function of time, interpreted as a slope angle, is averaged across subjects yielding a mean slope angle of 22° (yellow line). Bootstrap estimates and the 95% confidence intervals (gray background) confirm the positive correlation between the psychometric and neurometric buildup curves.

