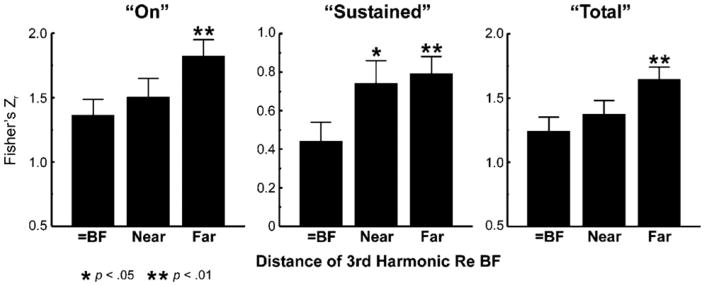
Figure 12.
Mean Pearson correlation coefficients (transformed to Fisher's Zr) quantifying the degree of similarity between waveforms of LL3 MUA evoked by mistuned and harmonic stimuli when the frequency of the mistuned third harmonic, before mistuning, is equal to the BF (under the “shift 3rd” condition;n = 16), near the BF (between 0.25 and 0.5 octave away; n = 14), and far from the BF (between 0.5 and 1 octave away; n = 16). Error bars represent SEM. Correlation coefficients are collapsed across direction of mistuning and across position of the third harmonic above and below the BF. Mean (Z-transformed) correlation coefficients for the three response windows analyzed are represented in separate plots, as indicated. Correlation coefficients are significantly larger (indicating greater similarity between responses) when the frequency of the mistuned component is far from the BF than when it is equal to the BF (planned one-tailed unpaired t test; p values are represented by the number of asterisks, as indicated at the bottom of the figure). Note the different ordinate range of the plot for “sustained” responses. All data are derived from the same 16 electrode penetrations at which “fixed F0” stimuli were presented.

