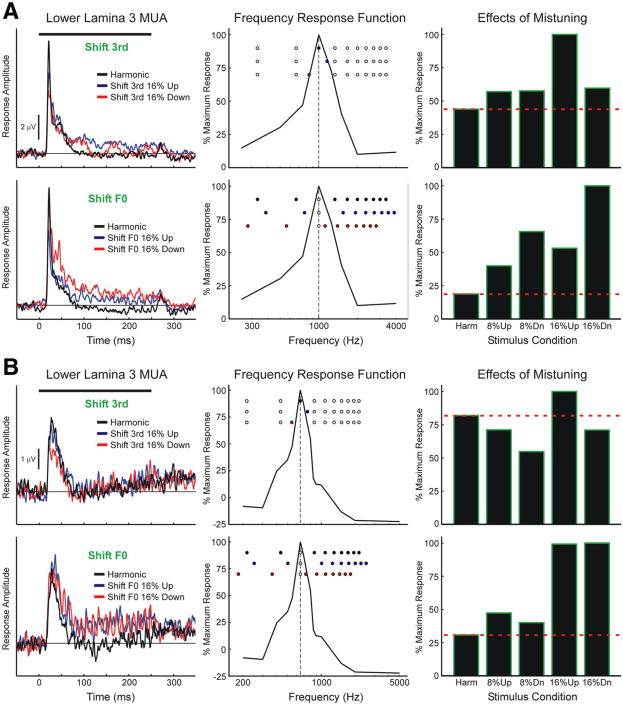
Figure 4.
Lower lamina 3 MUA evoked at two sites (A,B) by harmonic and mistuned stimuli. MUA evoked under “shift 3rd” and “shift F0” conditions is plotted in the top and bottom row of each panel,as indicated. Responses to harmonic stimuli are plotted in black; responses to stimuli mistuned via upward and downward shifts of 16% are plotted in blue and red, respectively (responses to stimuli with 8% shifts are omitted for clarity). Stimulus durationis represented by the black horizontal bar above the waveforms. FRFs of the sites (based on MUA integrated over the “total” 10–250ms time window) are shown in the center column and spectra of the stimuli are represented by the superimposed round symbols (top-to-bottom order: harmonic, shift 16% up, shift 16% down). Symbols filled blue and red denote components shifted upward and downward in frequency, respectively, relative to the harmonic condition. The dashed vertical line indicates the BF of the site (A, 1000 Hz; B, 650 Hz). Response sat each site under each stimulus condition are quantified by averaging the MUA within the 10 –250 ms time window; average MUA is then normalized to the maximal average MUA evoked within each stimulus block (bar graphsin right column; see Materials and Methods and Fig.1 for description of stimulus blocks). The red horizontal dashed line superimposed on the graphs indicates the normalized response amplitude under the harmonic condition

