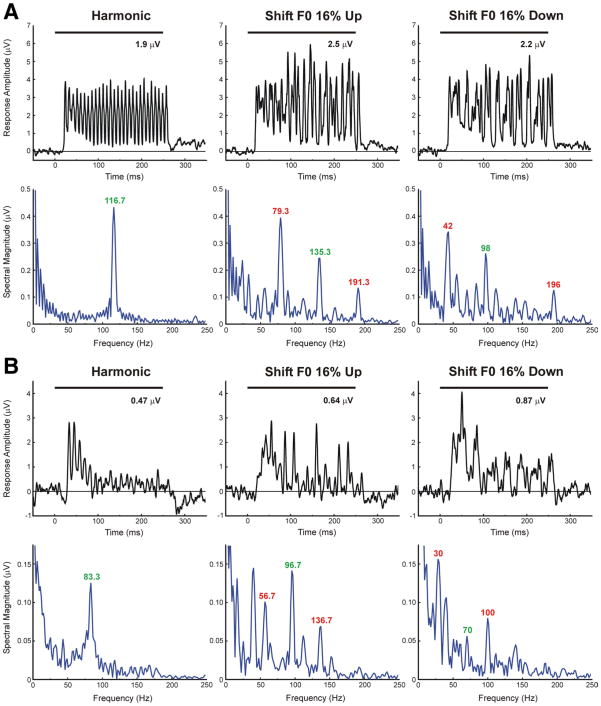
Figure 9.
Examples of temporally modulated responses evoked by harmonic and mistuned stimuli. LL3 MUA recorded at two A1 sites (A, B) displays temporal patterns that are phase locked to the F0 and predicted “beat” frequencies of the stimuli (harmonic, “shift F0” 16% up, and “shift F0” 16% down,as indicated). Plotson the top row (black) and bottom row (blue) of A and B represent MUA waveforms and corresponding spectra (discrete Fourier transform of MUA waveform from 10 to 250ms after stimulus onset), respectively. BFs of sites represented in A and B are 350Hz and 250 Hz, respectively. Stimulus duration is represented by the black horizontal bar above the waveforms. Green and red numbers in the response spectra indicate the frequency of spectral peaks corresponding to the F0 and “beat” frequencies of the stimuli, respectively. The value of the mean MUA computed over the “total” response window is indicated above the MUA waveforms.

