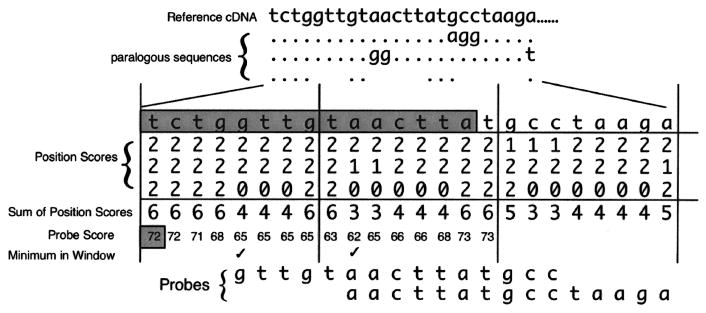
Figure 3.
Illustration of the scoring matrix for AutoProbe. At the top is an example of a BLAST alignment where the matches to the top query sequence (reference cDNA) are denoted by dots, base changes noted by letters, and gaps noted as spaces for three paralogous sequences given below the reference cDNA. The alignment is converted into a matrix of position scores that assigns values for the number of matches, mismatches, and gaps in the multiple alignment. The cDNA sequence from a gene of interest is compared to its paralogs systematically, by dividing the gene into multiple segments called “windows.” Every possible probe within each window along the cDNA (5′ to 3′) is assessed for specificity by calculating a probe score that reflected its uniqueness relative to the paralogs. Below the alignment is the scoring system for AutoProbe with the sum of the scores at each position (“Sum of Position Scores”). The “Probe Score” is the total of all “Sum of Position Scores” for a probe that starts at that position and continues to the right for a definable probe size (15 bases shown here in shaded rectangle for the query sequence located above the matrix). The first “Probe Score” is depicted in the shaded box. The “Probe Score” changes as the probe window (shaded sequence) slides to the right. The lowest probe score within each window determines which probe is selected. For probes with the same low score, the first probe is chosen to represent that window. The minimum “Probe Score” in a definable window (eight bases here) is denoted by the check mark. The most gene-specific probes have the lowest scores. The selected probes for the first two windows are shown at the bottom, both of which correspond to the regions with the highest specificity to the reference cDNA sequence.

