
Figure 4.
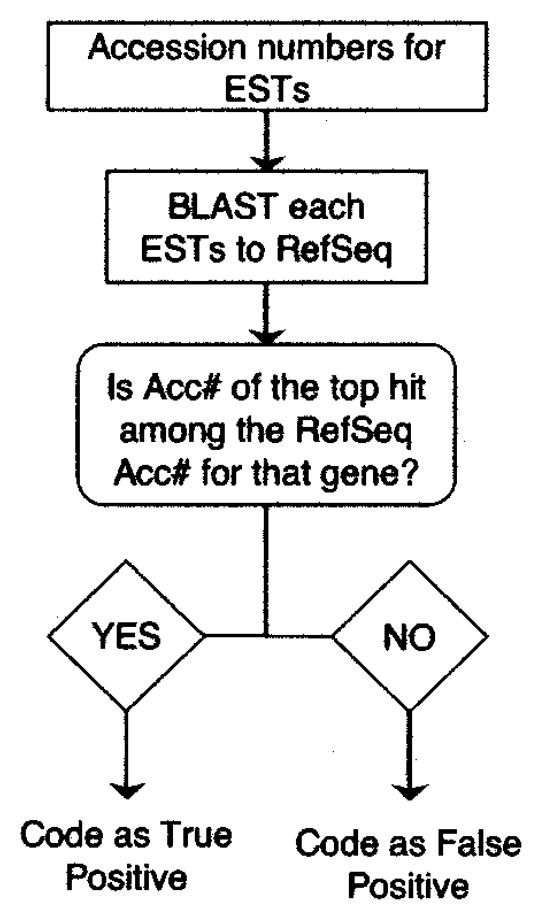
Flow chart for BackBLAST routine. Flowchart and decision matrix for BackBLAST algorithm is depicted. BackBLAST was used to confirm that ESTs were derived from the gene of interest (TPs). Formats are as described in Figure 1. BackBLAST program can sort through all the EST hits and determine if they represent the query or are false positives. It requires the list of EST accession numbers along with knowledge of which accession numbers in RefSeq correspond to the gene of interest.