
Figure 9.
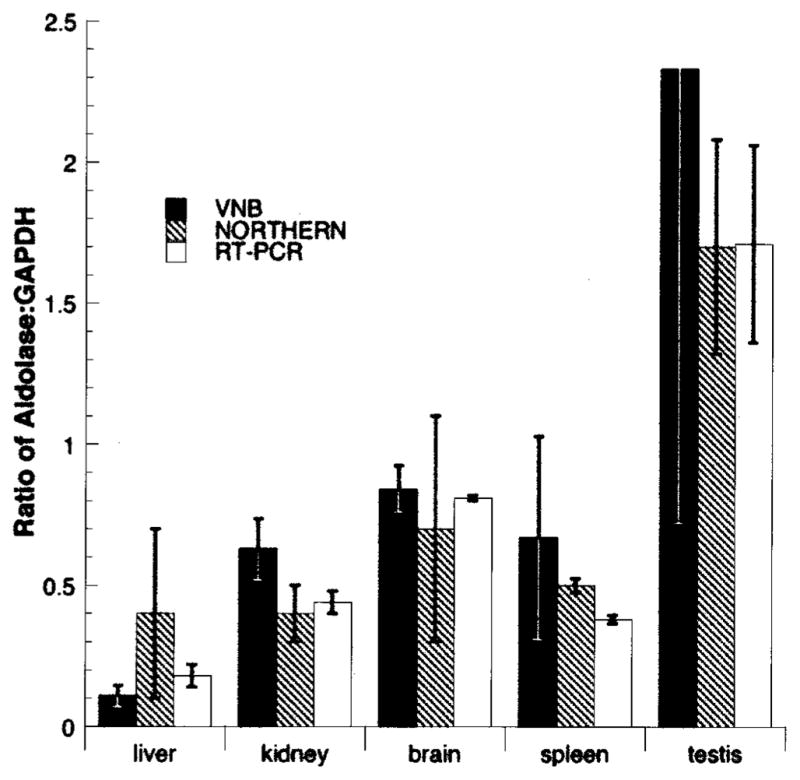
Demonstration of quantitative capacity of VNB. VNB-generated expression profiles for mouse aldoA and gapdh [GenBank:NM008084] were compiled using optimal parameters and quantitative libraries as described in Figure 6 and the ratio plotted (black bars). Ratio of aldoA/gapdh EST hits for liver, kidney, brain, spleen, and testis were 10:94, 58:92, 193:230, 6:9, and 7:3, respectively. Errors were calculated assuming a binomial distribution (p = 0.05). Data from Northern blots (cross-hatched bars) and qPCR (white bars) were determined from replicates of the same tissues as described in Materials and Methods.