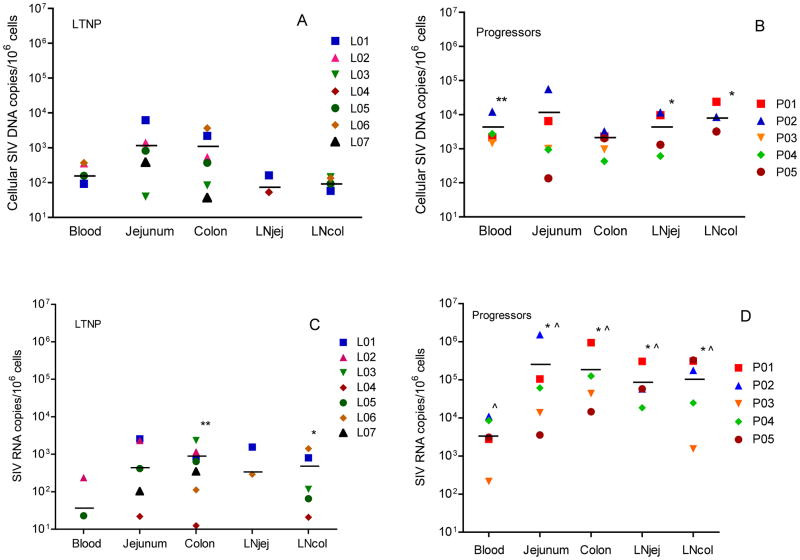
Figure 2.
Levels of cell-associated SIV DNA and RNA in PBMCs from peripheral blood, lamina propria lymphocytes from jejunum, colon, jenunal mesenteric lymph node (LNjej) and colonic mesenteric lymph node (LNcol) in LTNP and Progressors. (A): Cell-associated SIV DNA in blood and tissues of LTNP. (B): Cell-associated SIV DNA in blood and tissues of Progressors. **: P < 0.01; *: P < 0.05 when compared with the matched sample in LTNP. (C): Cell-associated RNA loads in blood and tissues of LTNP. **: P < 0.01; *: P < 0.05 when compared with peripheral blood within the same group. (D): Cell-associated RNA loads in blood and tissues of Progressors. *: P < 0.05 when compared with peripheral blood within the same group. ^: P < 0.05 when compared with the matched sample in LTNP. Each symbol represents a different animal. Horizontal lines indicate means.

