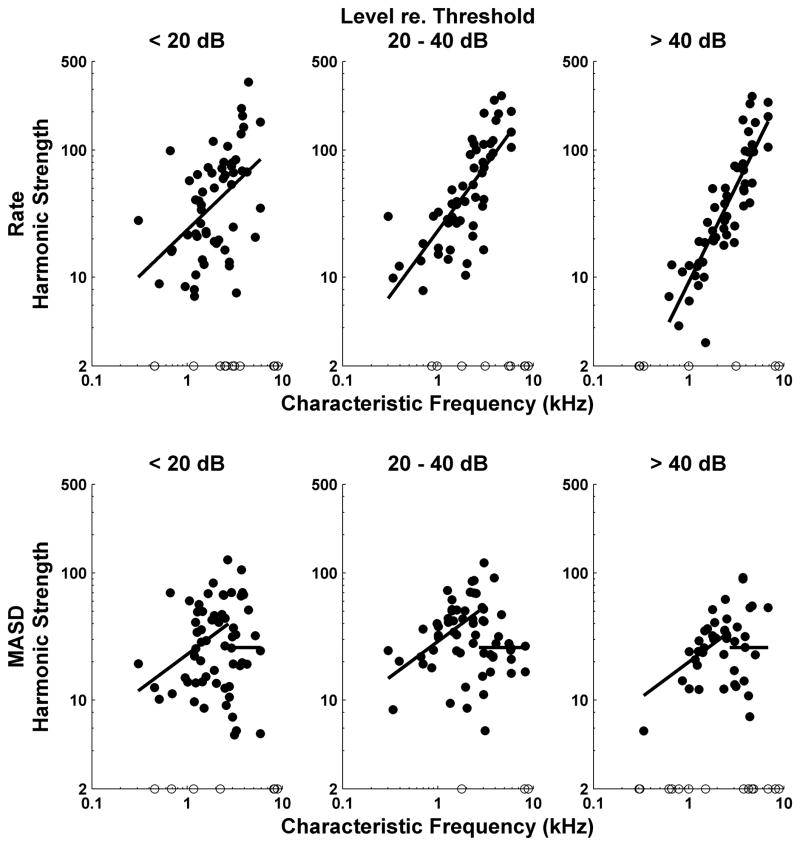
Figure 6.
Strength of rate-place and spatio-temporal cues to resolved harmonics as a function of CF for the entire set of responses to complex tone series with harmonics in cosine phase. Filled circles show harmonic strengths computed from best-fitting curves to profiles of firing rate (top) and MASD (bottom) against neural harmonic number. Open circles along the horizontal axis show data points for which the best fitting curve had no reliable oscillatory component. Results are grouped by level relative to each fiber’s threshold for a pure tone at CF. Solid lines show best fitting lines across all level groups obtained from analyses of covariance. Separate analyses were performed for rate and MASD, and for CFs below and above 2700 Hz, respectively.

