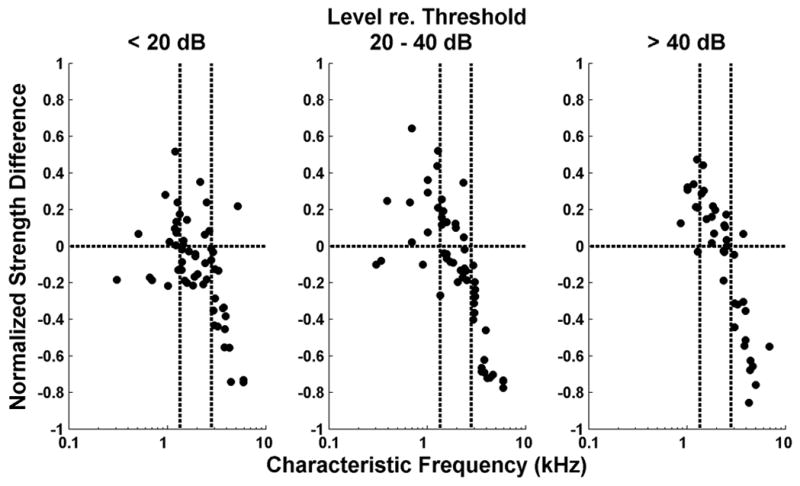
Figure 7.

Comparison of the strengths of rate-based and spatio-temporal representations of pitch. Symbols show normalized strength differences as a function of CF for the AN fiber population. Positive values mean greater strength for the spatio-temporal representation. Results are grouped by level relative to each fiber’s threshold for a pure tone at CF as in Figure 6. Vertical dashed lines indicate the CF cutoffs used in the analysis of variance (see text). Harmonics in cosine phase.
