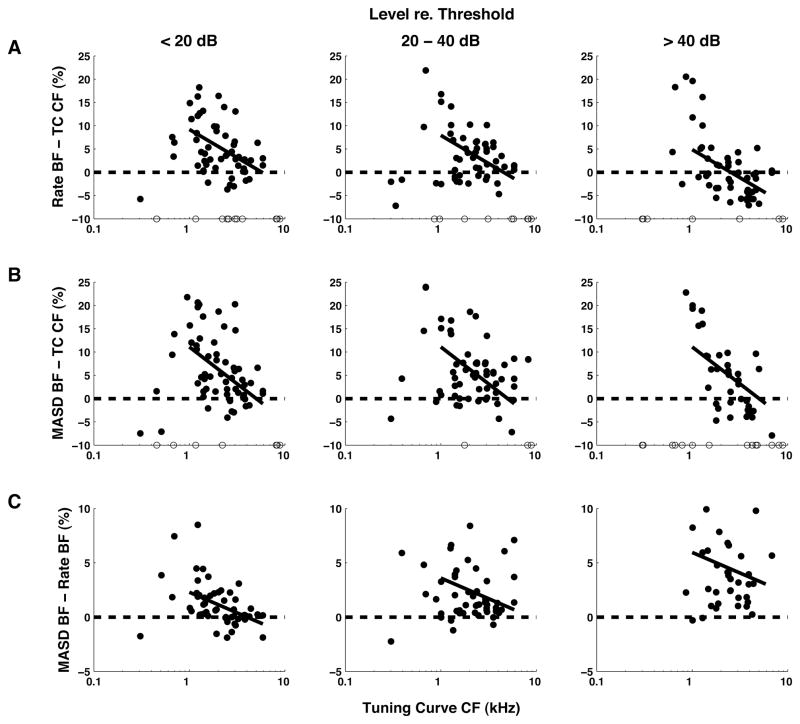
Figure 8.
Relationships between BF estimated from rate and MASD profiles in response to harmonic complex tones, and CF estimates from pure-tone tuning curves. Filled circles show differences between estimates, expressed as a percentage of the tuning-curve CF. Results are grouped by stimulus level relative to each fiber’s threshold for a pure tone at CF. Open circles along the horizontal axis indicate measurements for which a BF could not be reliably estimated from rate or MASD profiles. Solid lines show the best fitting linear models (based on an analysis of covariance) across all levels for CFs above 1 kHz. Harmonics in cosine phase.

