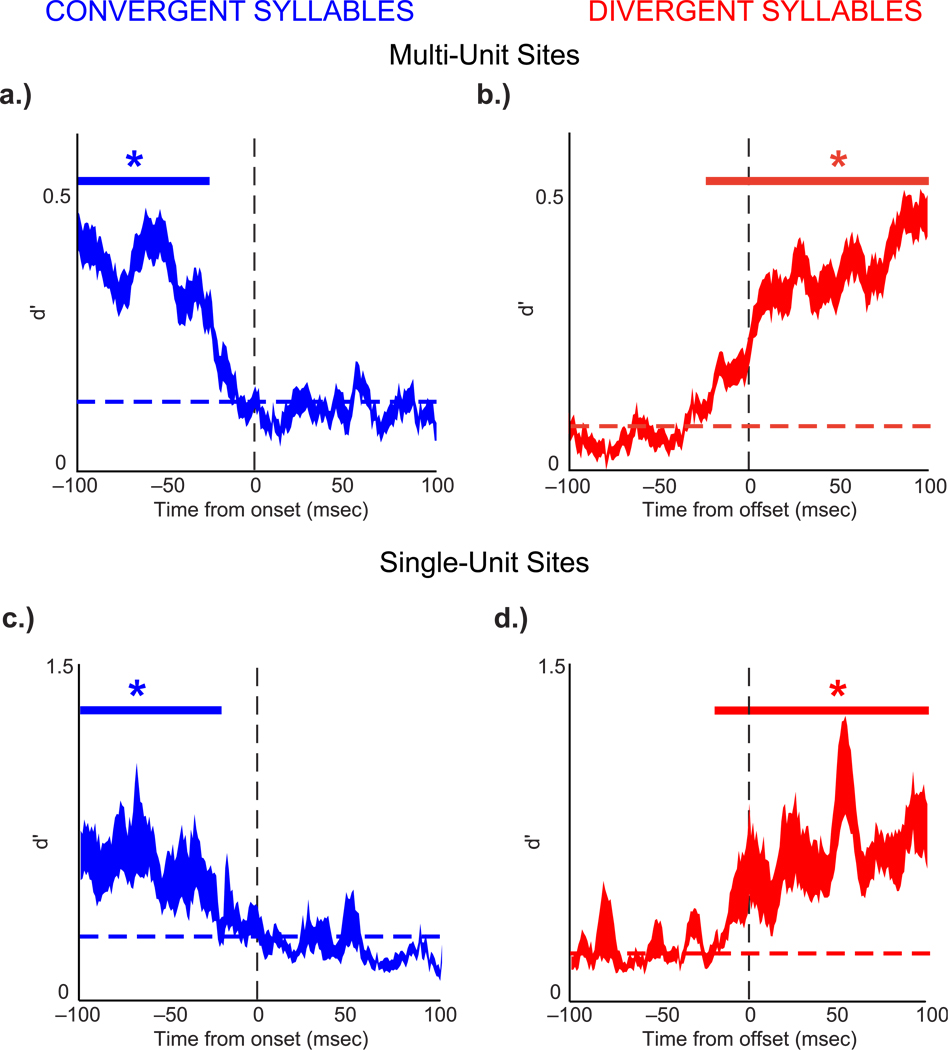
Figure 11. Time-varying differences in neural activity at convergent and divergent syllables.
The mean +/− 1 S.E. difference (d’) between neural activity recorded when the same syllable is produced during different sequences. (a and c) Differences in neural activity for multi-unit and single unit sites, respectively, averaged across all convergent syllables, aligned at the onset of the convergent syllable. The solid blue line at top indicates when d’ values differed significantly (KS-Test, p < 0.05) from the d’ in the 5 msec bin immediately following syllable onset (dashed blue line). (b and d) Differences in neural activity for multi-unit and single-unit sites, respectively, averaged across all divergent syllables, aligned at the offset of the divergent syllable. The solid red line at top indicates when d’ values differed significantly from the 5 msec bin immediately after the onset of the divergent syllable (dashed red line).

