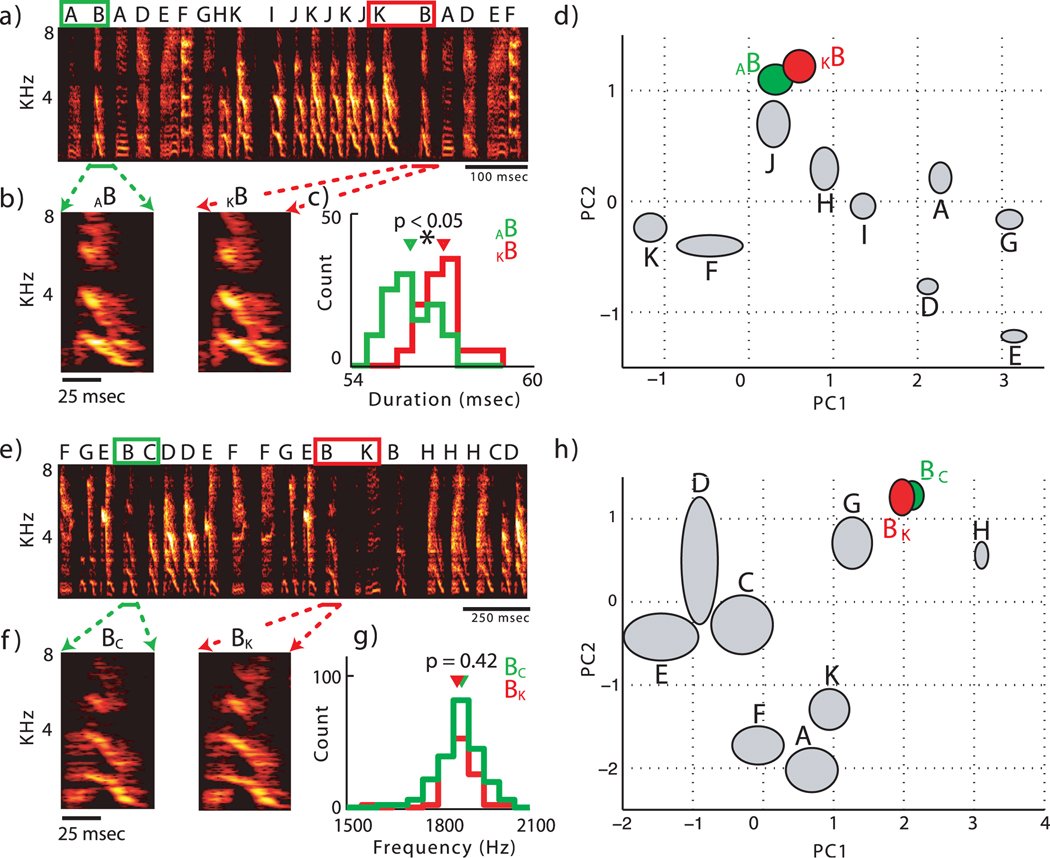
Figure 3. Sequence-dependent differences in phonology.
(a) Spectrogram of approximately 1 second of song from BF04. The convergent syllable B is highlighted: AB in green, and KB in red. (b) Average spectrograms of 10 examples of syllable B in each sequence. (c) Histogram of the durations of syllable B in each sequence. (d) Mean +/− one standard deviation ellipses for the first two principal components (PC1 and PC2) of syllable B found in each sequence, as well as all other syllables from the bird’s repertoire (in gray) for comparison. Syllable AB is significantly different from KB at p < 0.0001. (e) Spectrogram of approximately 1.5 seconds of song from BF05. Note that the letters assigned to each syllable are arbitrarily chosen for each bird, so that the acoustic similarity of syllable B in this case (for bird BF05) to syllable B from bird BF04 is not meaningful. The divergence from syllable B is highlighted: BC in green, and BK in red. (f) Average spectrograms of 10 examples of syllable B in each sequence. (g) Histogram of the pitch of syllable B in each sequence. (h) Mean +/− one standard deviation ellipses for the first two principal components of syllable B found in each sequence, as well as all other syllables from the bird’s repertoire (in gray) for comparison. Syllable BB is significantly different from BC at p < 0.0001.

