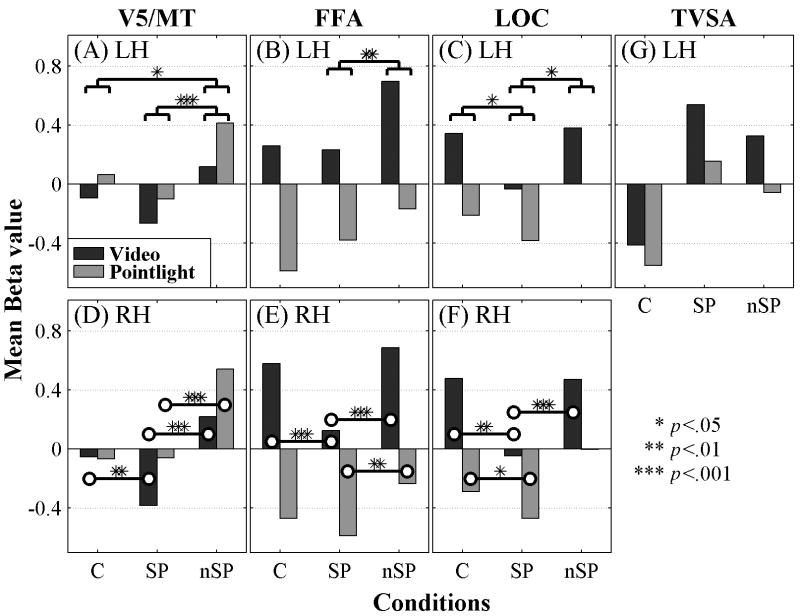
Figure 3.
Mean relative activations for video and point-light in the ROIs for the left hemisphere (LH) in (A) V5/MT, (B) FFA, and (C) LOC, and for the right hemisphere (RH) in (D) V5/MT, (E) FFA, and (F) LOC. Simple contrasts with Bonferroni corrections on the main effects of condition and their levels of significance (A, B, D). Paired-t tests on the interactions and their levels of significance (C, E, F). Activations extracted from the TVSA are shown in (G) without statistics. (Note x-axis labels: C = control, SP = speech, nSP = non-speech.)

