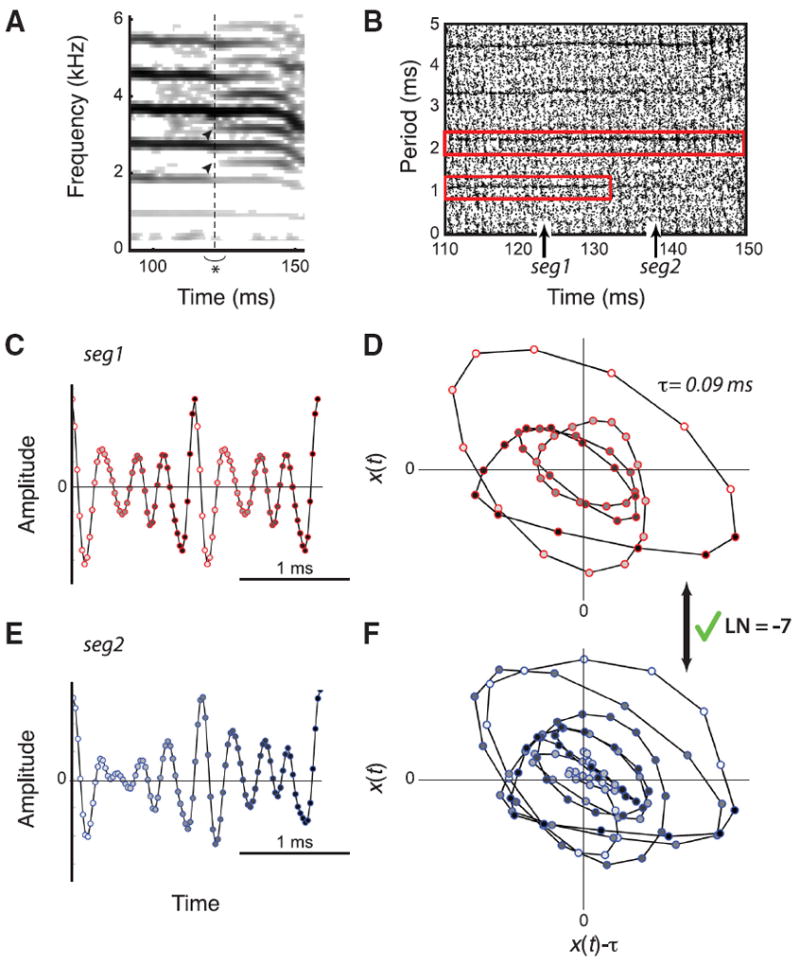
Figure 3. The only real period doubling found in the contact call of an adult male zebra finch.

A, Spectrogram of sound signal. Visual inspection shows new spectral components (arrowheads) starting at ~12 ms (dashed vertical line) at half the frequency spacing. B, The CR plot shows that the periodicity of the signal suddenly jumps from ~1 to ~2 ms, which is a strong indication for a period doubling. Upward arrows indicate the location of the extracted segments seg1 and seg2 for the topological analysis. ε = 0.001, which is 7.8% of the RMS value. C, E, Time series of the extracted segments: period-1 segment (seg1) (C) and period-2 segment (seg2) (E). The change in face color of the markers from white to black indicates time progression. D, F The corresponding orbits with time-delay τ = 0.09 ms. The linking number between period-1 and period-2 orbits is an odd integer LN = −7. This value is indicative of a real period doubling.
