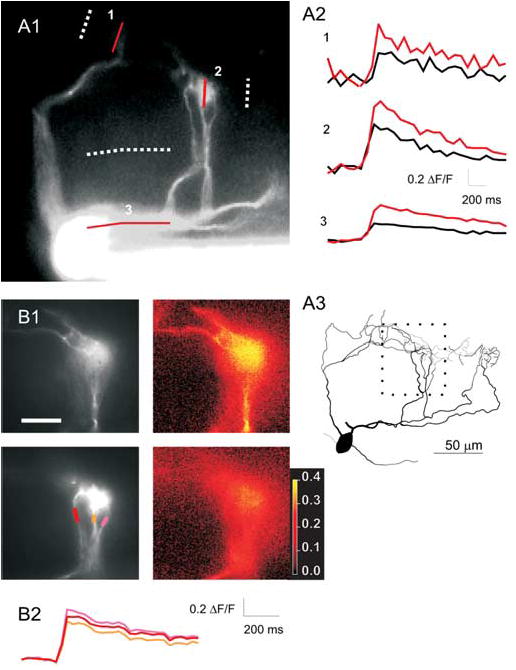
Figure 2.

Backpropagation of APs to AOB mitral cell tufts. A1, Fluorescence image (20× objective) of an AOB mitral cell showing multiple dendrites converging on two glomeruli. Solid and dotted lines (1–3) show locations from which calcium transients and background fluorescence were measured in A2. Calcium transients evoked at the locations indicated in A1 by single APs (black) or pairs of APs at 40 Hz (red). A3, Reconstruction of the cell in A1 including additional tufts (on the right) that were not visible in the fluorescence image. The area imaged in B1 is indicated by the dotted square. B1, Images (60×) of the subregion of the dendrite shown in A3. Two planes of focus are shown (top and bottom rows). Grayscale images show morphology, and color images plot peak ΔF/F for each pixel in the same focal planes shown on the left. ΔF/F appears to be uniform throughout all branches that can be observed. B2, ΔF/F plotted (in corresponding colors) versus time for the three dendrites seen in the bottom row of B1. Scale bar: (in B1) A1, 100 μm; B1, 50 μm. The color bar shows values of ΔF/F for the images in the right column of B1.
