Figure 3.

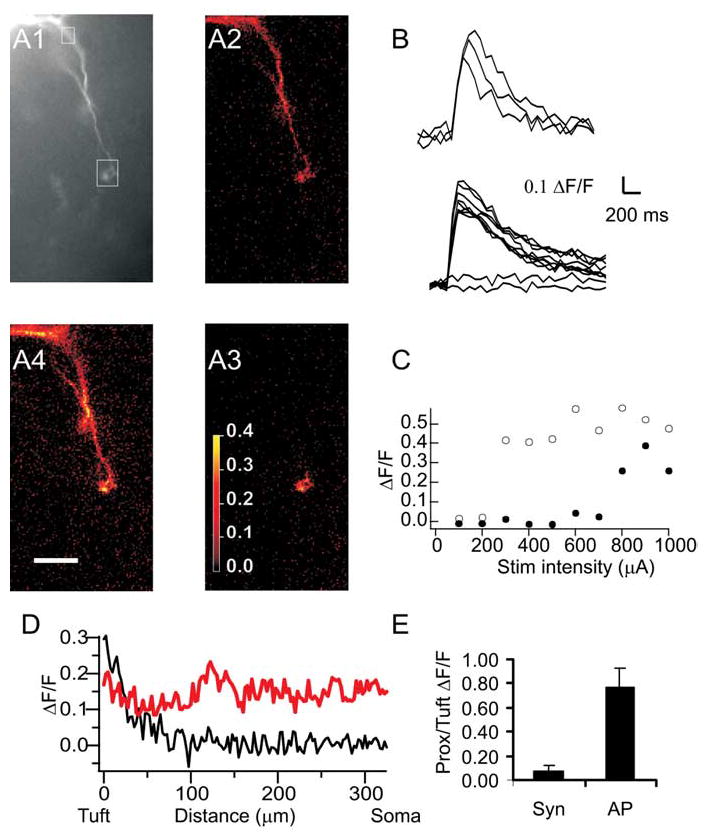
Synaptically evoked calcium transients. A1, Fluorescence image (20× objective) of the dendritic tree of an AOB mitral cell. The boxes show regions of interest from which data in B and C are taken. A2–A4, ΔF/F maps of calcium transients evoked in this cell by a single backpropagating AP evoked by somatic current injection (A2) and by low- (A3) or high- (A4 ) intensity extracellular stimulation of synaptic input to one tuft. B, The traces show calcium transients evoked by three consecutive backpropagating APs (top traces) or by extracellular stimulation of varying intensities (as in C, bottom traces). C, Plot of peak ΔF/F at the tuft (open circles) and at the proximal dendrite (filled circles) as a function of stimulation (Stim) intensity. Low-intensity stimulation evoked no response. Higher-intensity stimulation (corresponding to A3, above) evoked a transient in the tuft (open circles), whereas the highest intensity stimulation (corresponding to A4, above) evoked a somatic AP and both tuft and somatic (closed circles) calcium transients. Scale bar, 50 μm. D, Plot of ΔF/F as a function of distance from the soma for tuft spike (black; A3) versus single backpropagating AP (red; A2). E, Average ratio of proximal (Prox) to tuft calcium transients in AOB mitral cells during tuft spikes (n = 9) and single backpropagating APs (n = 7 of these 9 cells). Syn, Synaptic. Error bars represent SEM.
