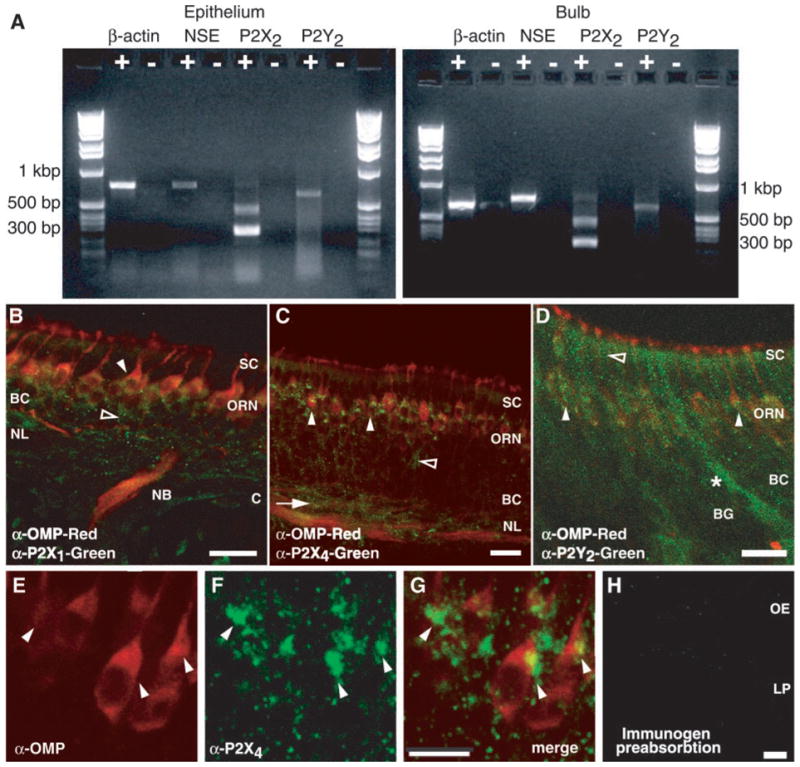
Figure 1.

Identification of purinergic receptors in the OE. A, RT-PCR analysis of P2X2 and P2Y2 mRNA in rat OE and bulb. The 643 bp product represents the P2Y2 isoform; the 499 bp product represents the P2X2–1 isoform, and the 292 bp product is the P2X2–2 isoform. Control β-actin (867 bp) and neuron-specific enolase (NSE; 753 bp) RT-PCR reactions are shown. +, Reverse-transcribed mRNA; −, omission of reverse transcriptase. B, C, Neonatal mouse OE showing punctate P2X1- and P2X4-IR (green) in OMP-positive (red) axons and ORNs (filled arrowheads) and in OMP-negative ORNs (open arrowheads) and basal cells (arrow). SC, Sustentacular cell layer; BC, basal cell layer; NL, nerve layer; C, cribriform plate; NB, nerve bundle. D, Neonatal mouse P2Y2 receptor-IR (green) occurs in ORNs (filled arrowheads), in the sustentacular cell layer (open arrowhead), and in a Bowman’s gland (BG, *). E–G, High-power projection of P2X4-IR (green, F–G) on OMP-positive ORNs (red, E, G). Note the localization of P2X4-IR to the plasma membrane, particularly in the supranuclear region of the ORNs (filled arrowheads). The projection was created by stacking 20 confocal images taken every 1.32 μm in the z-axis direction. H, P2X1 receptor antibody preabsorption. LP, Lamina propria. Scale bars: A–D, H, 20 μm; E–G, 10 μm.
