Figure 2.
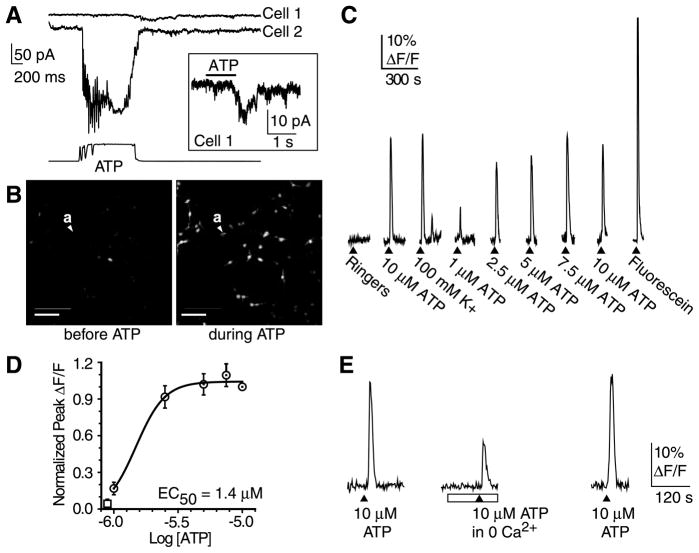
ATP evokes inward currents and increases intracellular Ca2+ in cultured mouse ORNs. A, Current responses to 10 μM ATP in two nystatin-patched ORNs held at −110 mV. Bottom trace shows the ATP stimulus profile recorded separately with an open electrode. Inset, Enlarged, compressed view of current from cell 1. B, Confocal images from fluo-4-AM-loaded ORNs taken before (left) and during (right) superfusion of 5 μM ATP. Scale bars, 50 μm. C, Representative fluorescence (F) increases from cell a in B in response to ATP (1–10 μM), Ringer’s solution, 100 mM K+ Ringer’s solution, and fluorescein (to show time course of solution delivery). D, Dose–response relationship for maximum % ΔF/F increases, relative to 10 μM ATP (mean ± SEM; n = 44 ORNs for each concentration). Curve was fitted by a Boltzmann equation, and the EC50 value of 1.4 μM was calculated by a nonlinear, least squares curve-fitting algorithm. Open square, Control 0 μM ATP (mean ± SEM). E, Representative traces from an ORN that responded to ATP (10 μM; arrowhead) in normal Ca2+ and in 0 Ca2+ + EGTA (open bar).

