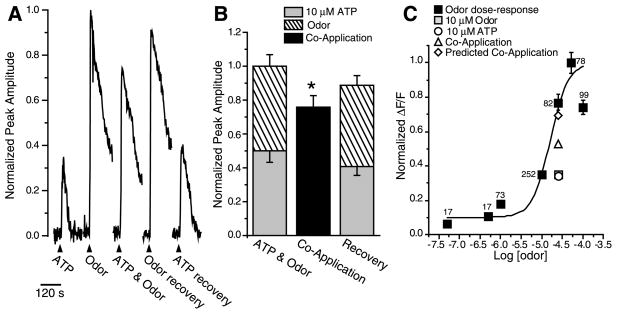
Figure 5.
ATP suppresses odor responses. A, Reduction of [Ca2+]i caused by the coapplication of ATP and odors compared with the summed response of ATP and odor. Shown are responses to 10 μM ATP, odor, coapplication of odor + ATP from a mouse ORN in a fluo-4-AM-loaded OE slice. Breaks in traces correspond to 5 min when images were not collected. B, Responses to individual application of ATP and odor were normalized to the sum of each response and averaged (stacked columns). The responses to the coapplication of ATP and odor were normalized to the summed individual responses and averaged (black columns). The recoveries, obtained after coapplication, were also normalized to the initial summed response. Bar graphs depict normalized peak Ca2+ transient amplitudes (means + SEM). n = 26 ORNs; *p = 0.001. C, Dose–response relationship for odor-evoked calcium transients measured in fluo-4-AM-loaded OE slices. Three concentrations of odor were superfused, in varying order, onto slices, and peak amplitudes were measured. Shown is the mean ± SEM; n is indicated next to each data point. Curve was fit by a Boltzmann function using Origin 6.0 software (Microcal Software, Northampton, MA). Note that data from B have been correlated to the odor dose–response relationship and plotted onto the dose–response relationship, slightly offset for clarity. For instance, because 10 μM odor is 0.35 U on the normalized odor dose–response relationship, the 10 μM odor from B is scaled to 0.35. The ATP response and the observed and predicted coapplication responses were also scaled appropriately.

