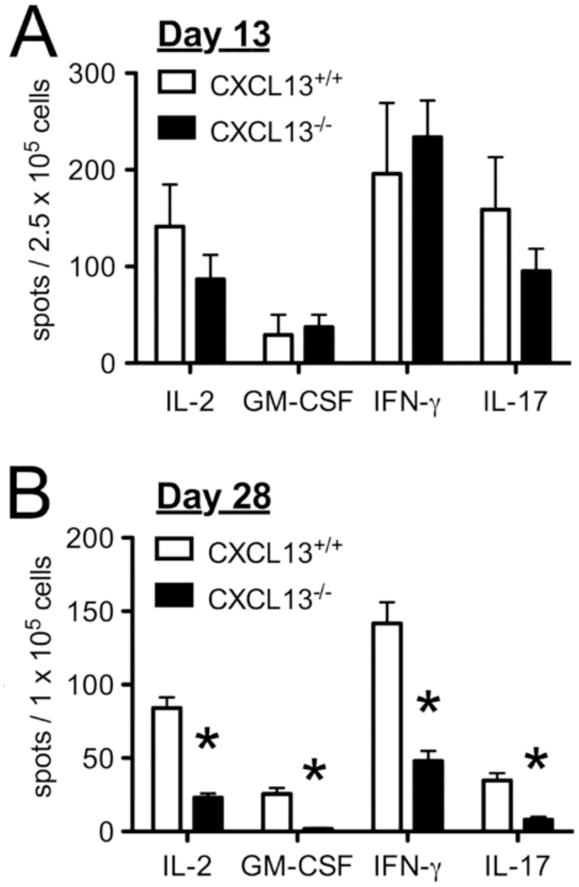
Figure 7.

MOG-specific T cell cytokine production in CXCL13+/+ and CXCL13−/−-mice during active immunization EAE. ELISpot assays were used to enumerate the number of splenic T cells producing each cytokine ex vivo following stimulation with MOG35–55 At peak disease, cells producing both IFN-γ (Th1) and IL-17 (Th17) were present in equivalent numbers in both hosts (A). Two weeks later, both Th1 and Th17 responses had waned in the CXCL13−/−-mice compared to the CXCL13+/+ controls * p < 0.05 by Student’s t-test for the indicated cytokines compared to CXCL13+/+ controls. All bars represent the mean ± SEM of numbers measured from at least triplicate samples.
