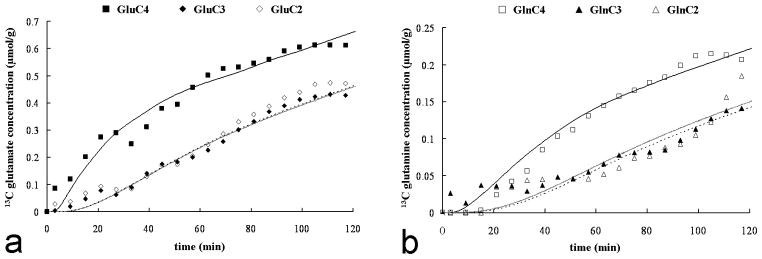
FIG. 5.
Time-courses of glutamate (A) and glutamine (B) 13C concentrations for the C4, C3 and C2 positions from one of the subjects during the infusion of [3-13C]lactate ([Lac]P ~ 2.7 mmol/L and 13C FE ~ 50%). The glutamate and glutamine C4 labeling are represented by squares (respectively close and open), while the glutamate C3 and C2 labeling by diamonds (respectively close and open) and glutamine C3 and C2 labeling by triangles (respectively close and open). The lines are the fits obtained with the metabolic model (C4: solid, dashed: C3, shaded: C2 positions). The scale for glutamine is increased approximately by a factor of 3 to facilitate the visualization of the kinetics.

