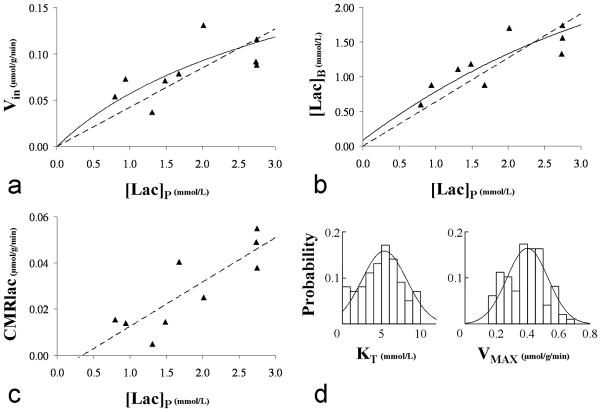
FIG. 6.
A Lactate influx plotted as a function of the plasma lactate concentration. The dashed straight line represents the linear regression which has a slope of 0.042 and a R2 value of 0.58. B. Brain lactate as a function of the plasma lactate concentration. The dashed straight line represents the linear regression which has a slope of 0.63 and a R2 value of 0.75. For both A and B, the solid curve line represents the best fit obtained from a least-square minimization using expressions [5] and [8] given by the reversible Michaelis-Menten model. C. Lactate net consumption plotted as a function of the plasma lactate concentration. The dashed straight line represents the linear regression: CMRlac (in μmol/g/min) = 0.019.[Lac]P-0.007, R2=0.72. D. Overlay of the probability density functions and corresponding histograms for KT and VMAX values derived from the Monte Carlo analysis (see Materials & Methods for details) of the data presented in A and B : KT= 5.1±2.7 mmol/L and VMAX=0.40±0.13 μmol/g/min (mean±SD).

