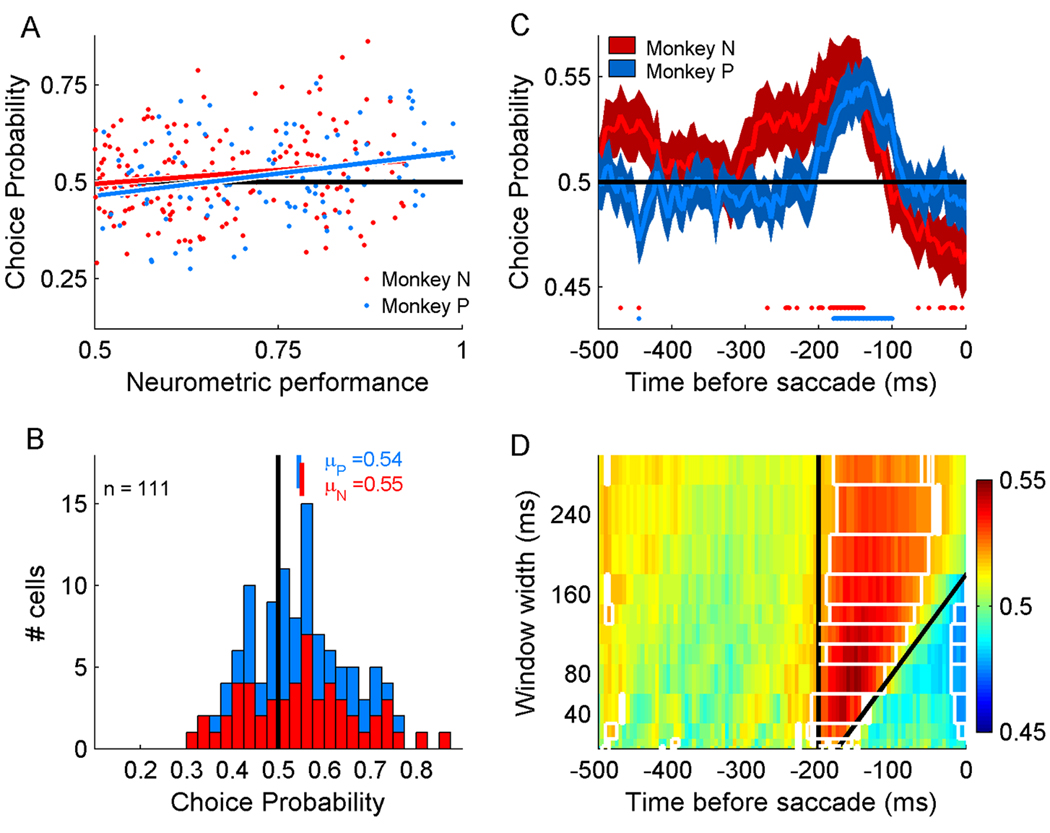
Figure 4. Temporal evolution of choice probability.
(A) Population comparison of CP and NP. Solid lines shows linear regression (rN =0.17, p<0.05; rP = 0.31, p<0.01), demonstrating that neurons more sensitive to the stimulus were also more informative about the animal’s choices during the task. Trials with the 8 and 12°/s reference speeds were analyzed independently, thus each neuron contributes twice to this summary if sufficient trials were recorded. This was the case in 172 neurons with 295 reference conditions. (B) Distribution of choice probabilities from cells with NP>0.75 (72 neurons, 111 reference conditions). Mean CPs calculated for individual animals were significantly greater than chance (p<0.01). (C) CP calculated in a sliding 80 ms window for neurons with NP>0.75. Traces are aligned on the time of the choice saccade and show mean±SEM. Spots at bottom of panel indicate time windows in which CP was significantly different from 0.5 (p<0.05). (D) Mean CP across neurons with NP>0.75 for window widths 5–300 ms. The region between the two black lines demarcates windows that include spikes in the period 180–200 ms before saccade initiation. White boxes in indicate time windows in which the mean CP is significantly different from chance (t-test, p<0.05).

