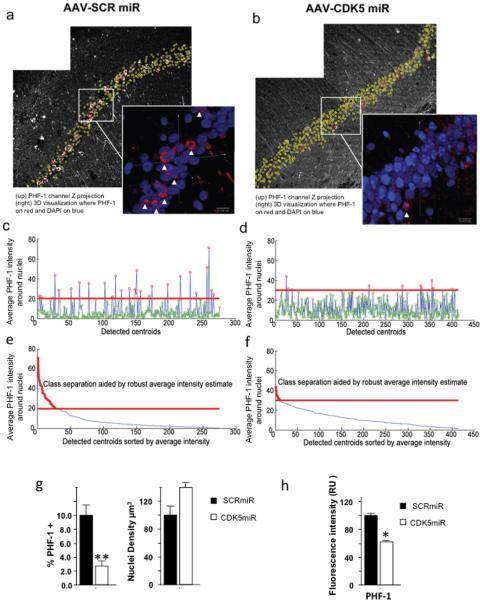
Figure 6. Silencing of CDK5 reduced the number of neurofibrillary tangles in the hippocampus of triple-transgenic Alzheimer mice.
In this figure, left side images a), c) and e) correspond to AAV-SCRmiR and the right side b), d) and f) correspond to AAV-CDK5miR injection. Representative PHF-1 channels of hippocampal CA1 region of 23 months old 3xTg-AD mice, imaged three weeks after a) AAV-SCRmiR or b) AAV-CDK5miR injection. Inserted panels show magnified 3D visualizations of CA1 cell nuclei, generated using bioView3D software (Kvilekval et al., 2010), where, PHF-1 channel is shown in red and Hoechst is in blue. Arrows point towards cells automatically classified as high PHF-1. Plots c) and d) show average PHF-1 intensities within detected cells where point color represents the classification result, red indicates high PHF-1 and green indicates low PHF-1. The red line separates the classes. Plots e and f show the same data sorted according to the average intensity, where the plot portion colored in red is classified as high PHF-1. Note, that the CDK5miR image set was acquired at 1.5 times higher PMT voltage and offset than the SCRmiR. The bar graph g) shows a significant difference in the percentage of CA1 cells classified as high PHF-1 for both conditions (left). The density of the detected nuclei (right) shows a tendency to increase in old mice treated with CDK5miR; h) Intensity fluorescence quantification of PHF-1 also decreased after CDK5miR treatment. Data is presented as mean ±S.E.M. n=8 to controls and n=10 to treated. * p< 0,05, ** p< 0,001.

