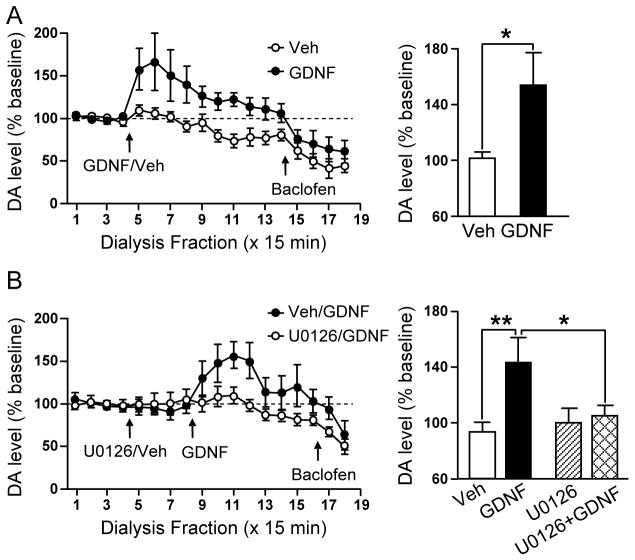
Figure 7. Application of GDNF into the VTA causes a rapid and sustained elevation of DA overflow in the NAc that is block by inhibition of the MAPK pathway.
A, Left, Time course of dialysate concentrations of DA from the NAc before and after intra-VTA infusion of 10 μg/μl/side (black circles) or vehicle (Veh, white circles). Two- way ANOVA (Treatment × Fractions) shows a significant effect of Treatment (F(1, 156) = 9.40, p < 0.01) and Fraction (F(13, 159) = 4.88, p < 0.001), and a significant interaction between both factors (F(13, 159) = 2.75, p < 0.01). Post-hoc analysis using the method of contrasts shows a significant difference between the vehicle and the GDNF conditions from fractions 5 to 14 (Ts > 1.81, ps < 0.05). The basal concentration of DA in dialysate was 1.97 ± 0.53 and 2.14 ± 0.42 nM for the Veh and GDNF group, respectively. Right, Bar graph comparing the DA levels in the NAc following GDNF or vehicle injections into the VTA. The values were averaged from fractions 5 to 8. n = 8 (Veh), n = 6 (GDNF). B, Left, The MEK inhibitor U0126 (0.5 μg/μl/side) or vehicle were infused in the VTA 1 hr before the application of GDNF (10 μg/μl/side) or vehicle. Time course of dialysate concentrations of DA from the NAc before and after intra-VTA infusion of, GDNF (black circles) or GDNF/U0126 (white circles). Two-way ANOVA (Treatment × Fractions) shows a significant effect of Treatment (F(1, 156) = 8.35, p < 0.01) and Fraction (F(13, 159) = 4.03, p < 0.001), and no interaction between both factors (F(13, 159) = 1.86, p = 0.12). Post-hoc analysis using the method of contrasts shows a significant difference between the Veh/GDNF and the U0126/GDNF conditions from fractions 11, 12, 15 and 17 (ts > 1.68, ps < 0.05). The basal concentration of DA in dialysate was 0.75 ± 0.18 and 1.13 ± 0.15 nM for the Veh/GDNF and U0126/GDNF group, respectively. Right, Bar graph comparing the DA levels in the NAc following vehicle, U0126 or GDNF injections into the VTA. The values were averaged from fractions 5 to 8 for the vehicle and U0126 injections and 9 to 12 for the GDNF injections. n = 6 (Veh/GDNF), n = 8 (U0129/GDNF). A&B, Intra-VTA infusion of 75 ng of baclofen confirmed the functional connection between the VTA and NAc placements by reducing NAc DA overflow in the four groups. * p < 0.05, ** p < 0.01.

