Figure 4.
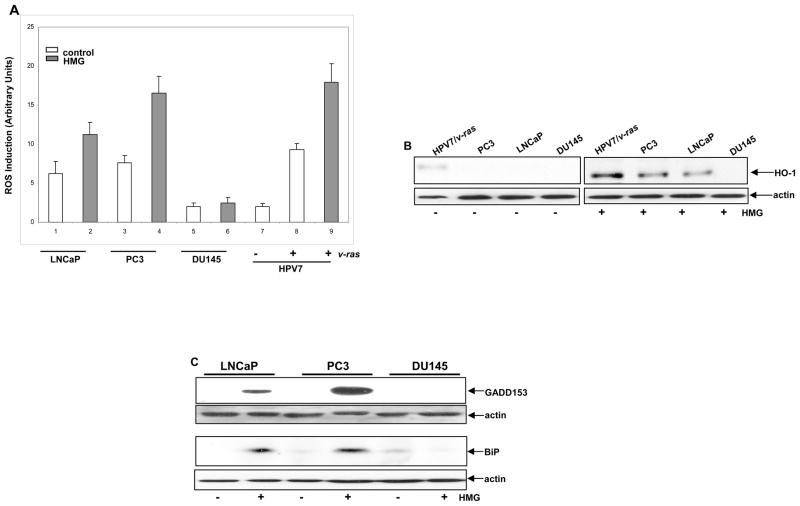
Perturbation of the redox state in LNCaP and PC3 cells upon PKC suppression. (A) Following treated with HMG, the cells were stained with DCF, and analyzed for ROS levels using a flow cytometer. Error bar represents SD over 5 independent experiments (n=5, p<0.05). (b and c) The expression of HO-1 (B) or GADD153 and BiP (c) in the cells, after PKC suppression, was tested by immunoblotting. Equal loading total proteins were verified by actin expression.

