
Fig. 3.
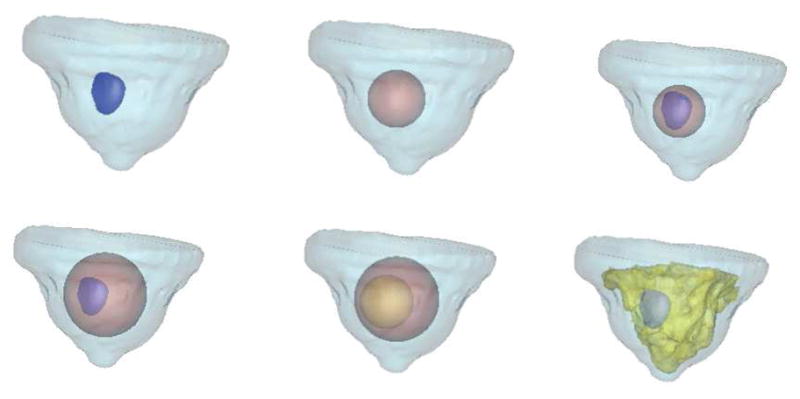
Surface renderings of the six test cases used in this study are shown, with two-three regions created. Clockwise from top left, the six test cases show cases (1) the outer breast contour and tumor created from clinical MRI (2) outer breast and simulated spherical inclusion (3) Outer breast, sphere and tumor (4) Outer breast, larger sphere and tumor (5) Outer breast and two spherical inclusions and (6) Outer breast, fibroglandular and tumor tissues.