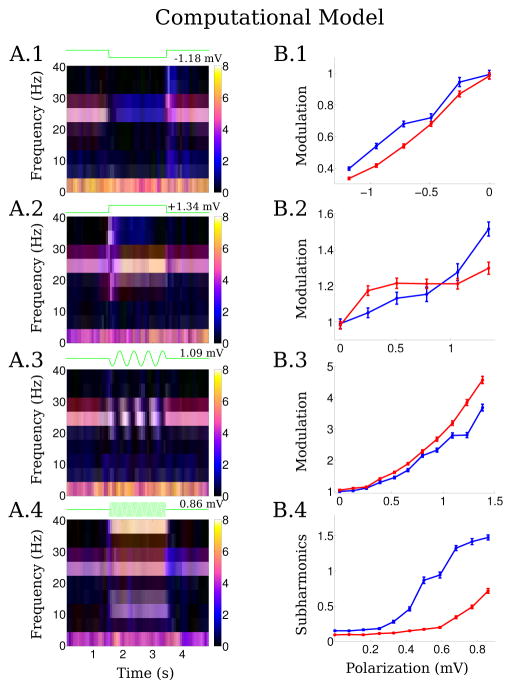
Figure 4.
Changes in LFP during simulation of weak-field stimulation in the computational model. A, Left column, Spectrograms of the local field potential (in dB) during the application of fields with different waveforms (fields applied between 1.5 and 3.5 s). A.1, Negative DC stimulation (ΔV = −1.18 mV). A.2, Positive DC stimulation (ΔV = 1.34 mV). A.3, Low-frequency AC stimulation (2 Hz, ΔV = 1.09 mV). A.4, Higher frequency AC stimulation (25.5 Hz, ΔV = 0.86 mV). B, Right column, Summarizes the effects of the fields on the ongoing gamma activity for two different values of the e-e synaptic coupling constant w̄ee, 0.325 (blue line) and 0.275 (red line) capturing some of the variability seen in slice. The range of field magnitudes applied is the same in all cases (E ∈ [0, 12] V/m), but horizontal axis is given in terms of the resulting average cellular polarization, ΔV, to reflect frequency-dependent gain g. B.1– 4, Power modulation is measured as in the slice data. Error bars indicated SEM.

