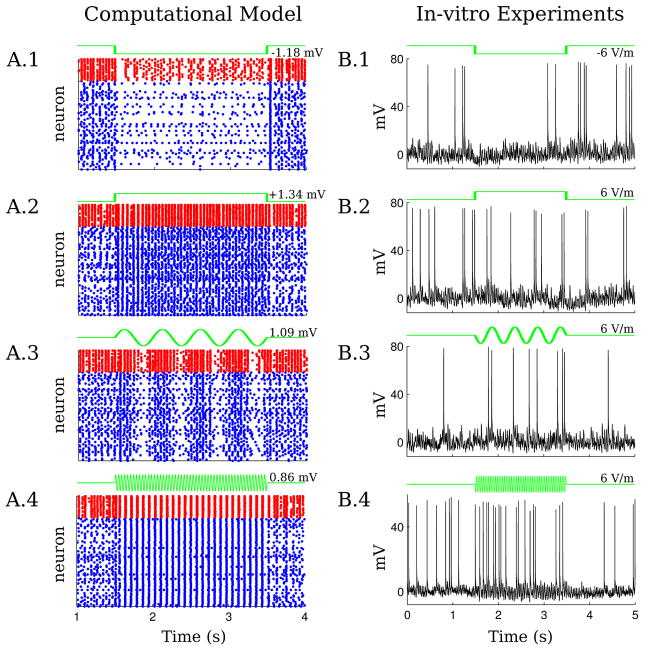
Figure 6.
Model predictions for spiking activity and validation with intracellular recordings. A, Raster plots on the left column indicate spiking activity for a sample of model neurons during electrical stimulation (blue for excitatory and red for inhibitory). The frequencies and amplitudes of the applied fields are the same as in Figure 4 A. A.1, Negative DC stimulation. A.2, Positive DC stimulation. A.3, Low-frequency AC stimulation (2 Hz). A.4, Higher frequency AC stimulation (25.5 Hz). B, Right column, Illustrative intracellular recordings in slices during electrical stimulation (6 V/m). B.1, Negative DC stimulation. B.2, Positive DC stimulation. B.3, Low-frequency AC stimulation (2 Hz). A.4: Higher frequency AC stimulation (26 Hz). Quantitative comparison between the model and the intracellular recordings requires aggregating data over multiple frames (see Fig. 7).

