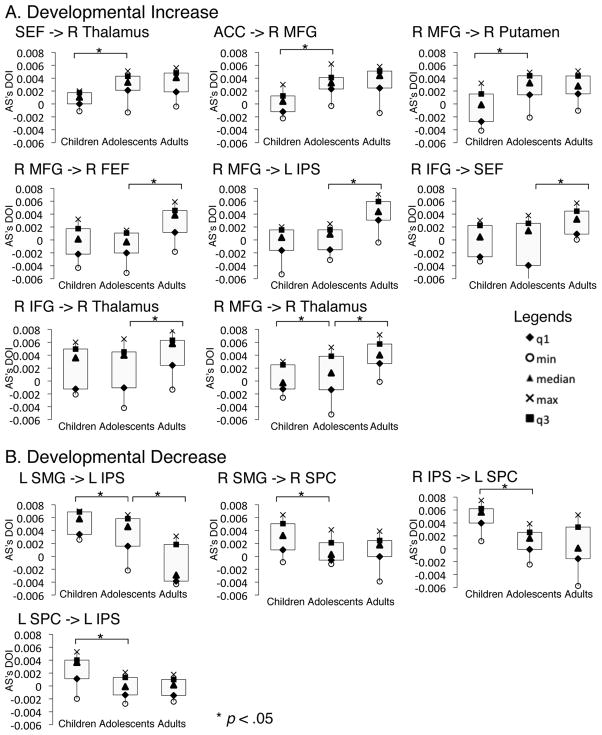
Figure 5.
Box-plots of developmental changes in effective connectivity. These are connections where effective connectivity strengths were significantly different across age groups (also see figure 4). For every box-plot, the dependent measure (Y-axis) is the effective connectivity strength (difference of influencing strength, DOI) of the AS task. Panel A are connections that showed developmental increase in effective connectivity strengths (adults significantly greater than adolescents and/or adolescents significantly greater than children). Panel B are connections that showed developmental decrease in effective connectivity strengths (children significantly greater than adolescents and/or adolescents significantly greater than adults).

